Deferred Entity Destruction in ECS: A Mark-and-Sweep Approach

I found a bug in the Untold Engine in the weirdest way possible. After merging several branches into my develop branch, I decided to run a Swift formatter on the engine. Three files were changed. I ran the unit tests, they all passed, and then I figured I’d do a final performance check before pushing the branch to my repo.

So, I launched the engine, loaded a scene, and then deleted the scene.

The moment I did that, the console log started flooding with messages like:

  • Entity is missing or does not exist.
  • Does not have a Render Component.

This was the first time I had ever seen the engine behave like this when removing all entities from a scene. My first reaction was: the formatter broke something.

But the formatter’s changes were only cosmetic. There was no reason for this kind of bug.

At that point I was lost. So, I asked ChatGPT for some guidance, and it mentioned something interesting: maybe the formatter’s modifications had affected timing. That hint got me thinking.

After tinkering a bit, I realized the truth: this bug was always there. The formatter just exposed it earlier.

The Real Problem

My engine’s editor runs asynchronously from the engine’s core functions. When I clicked the button to remove all entities, the editor tried to clear the scene immediately — even if those entities were still being processed by a kernel or the render graph.

In other words, the engine was destroying entities while they were still in use. That’s why systems started complaining about missing entities and missing components.

The Solution: A Mini Garbage Collector

What I needed was a safe way to destroy entities. The fix was to implement a simple “garbage collector” for my ECS, with two phases:

  • Mark Phase – Instead of destroying entities right away, I mark them as pendingDestroy.
  • Sweep Phase – Once I know the command buffer has completed, I set a flag. In the next update() call, that flag triggers the sweep, where I finally destroy all entities that were marked.

This way, entity destruction only happens at a safe point in the loop, when nothing else is iterating over them.

Conclusion

What looked like a weird formatter bug turned out to be a timing bug in my engine. Immediate destruction was unsafe — the real fix was to defer destruction until the right time.

By adding a simple mark-and-sweep system, I now have a mini garbage collector for entities. It keeps the engine stable, avoids “entity does not exist” spam, and gives me confidence that clearing a scene won’t blow everything up mid-frame.

Thanks for reading.

From 26.7 ms to 16.7 ms: How a simple Optimization Boosted Performance

In my previous article, I talked about my attempts to improve the performance of the Untold Engine. Even after adding GPU frustum culling to reduce the CPU workload, the engine was still CPU-bound — stuck at around 26.7 ms per frame.

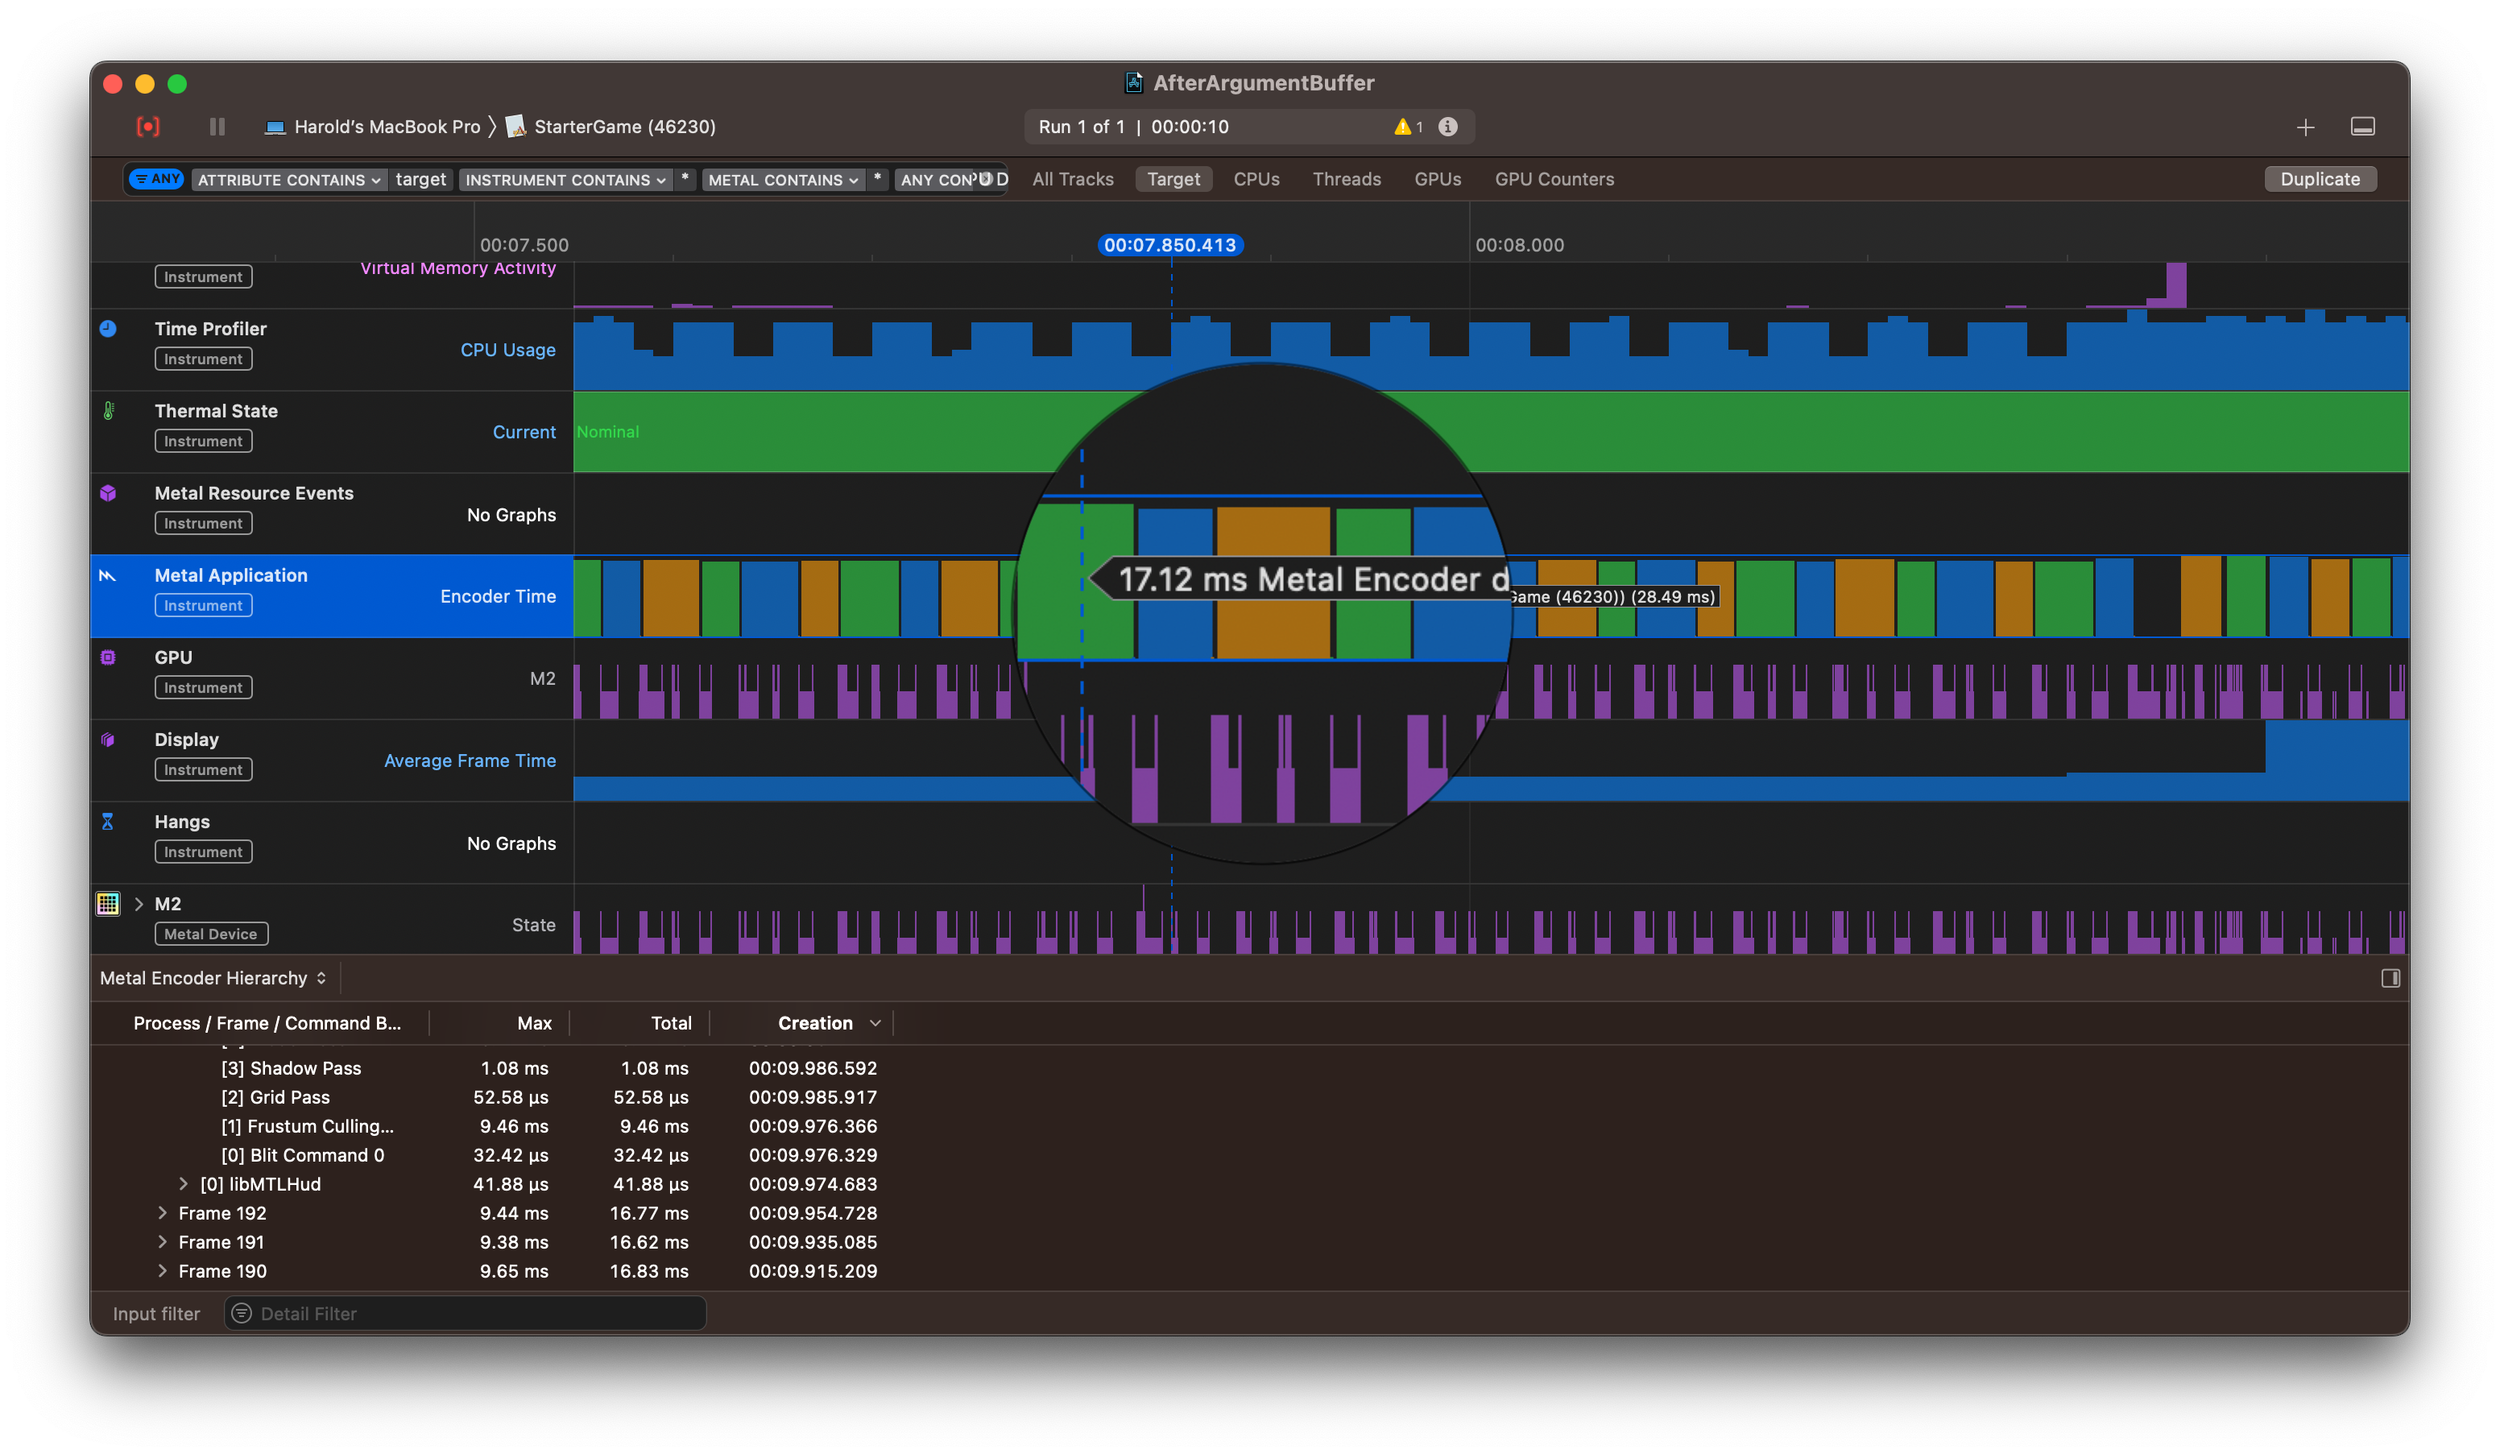
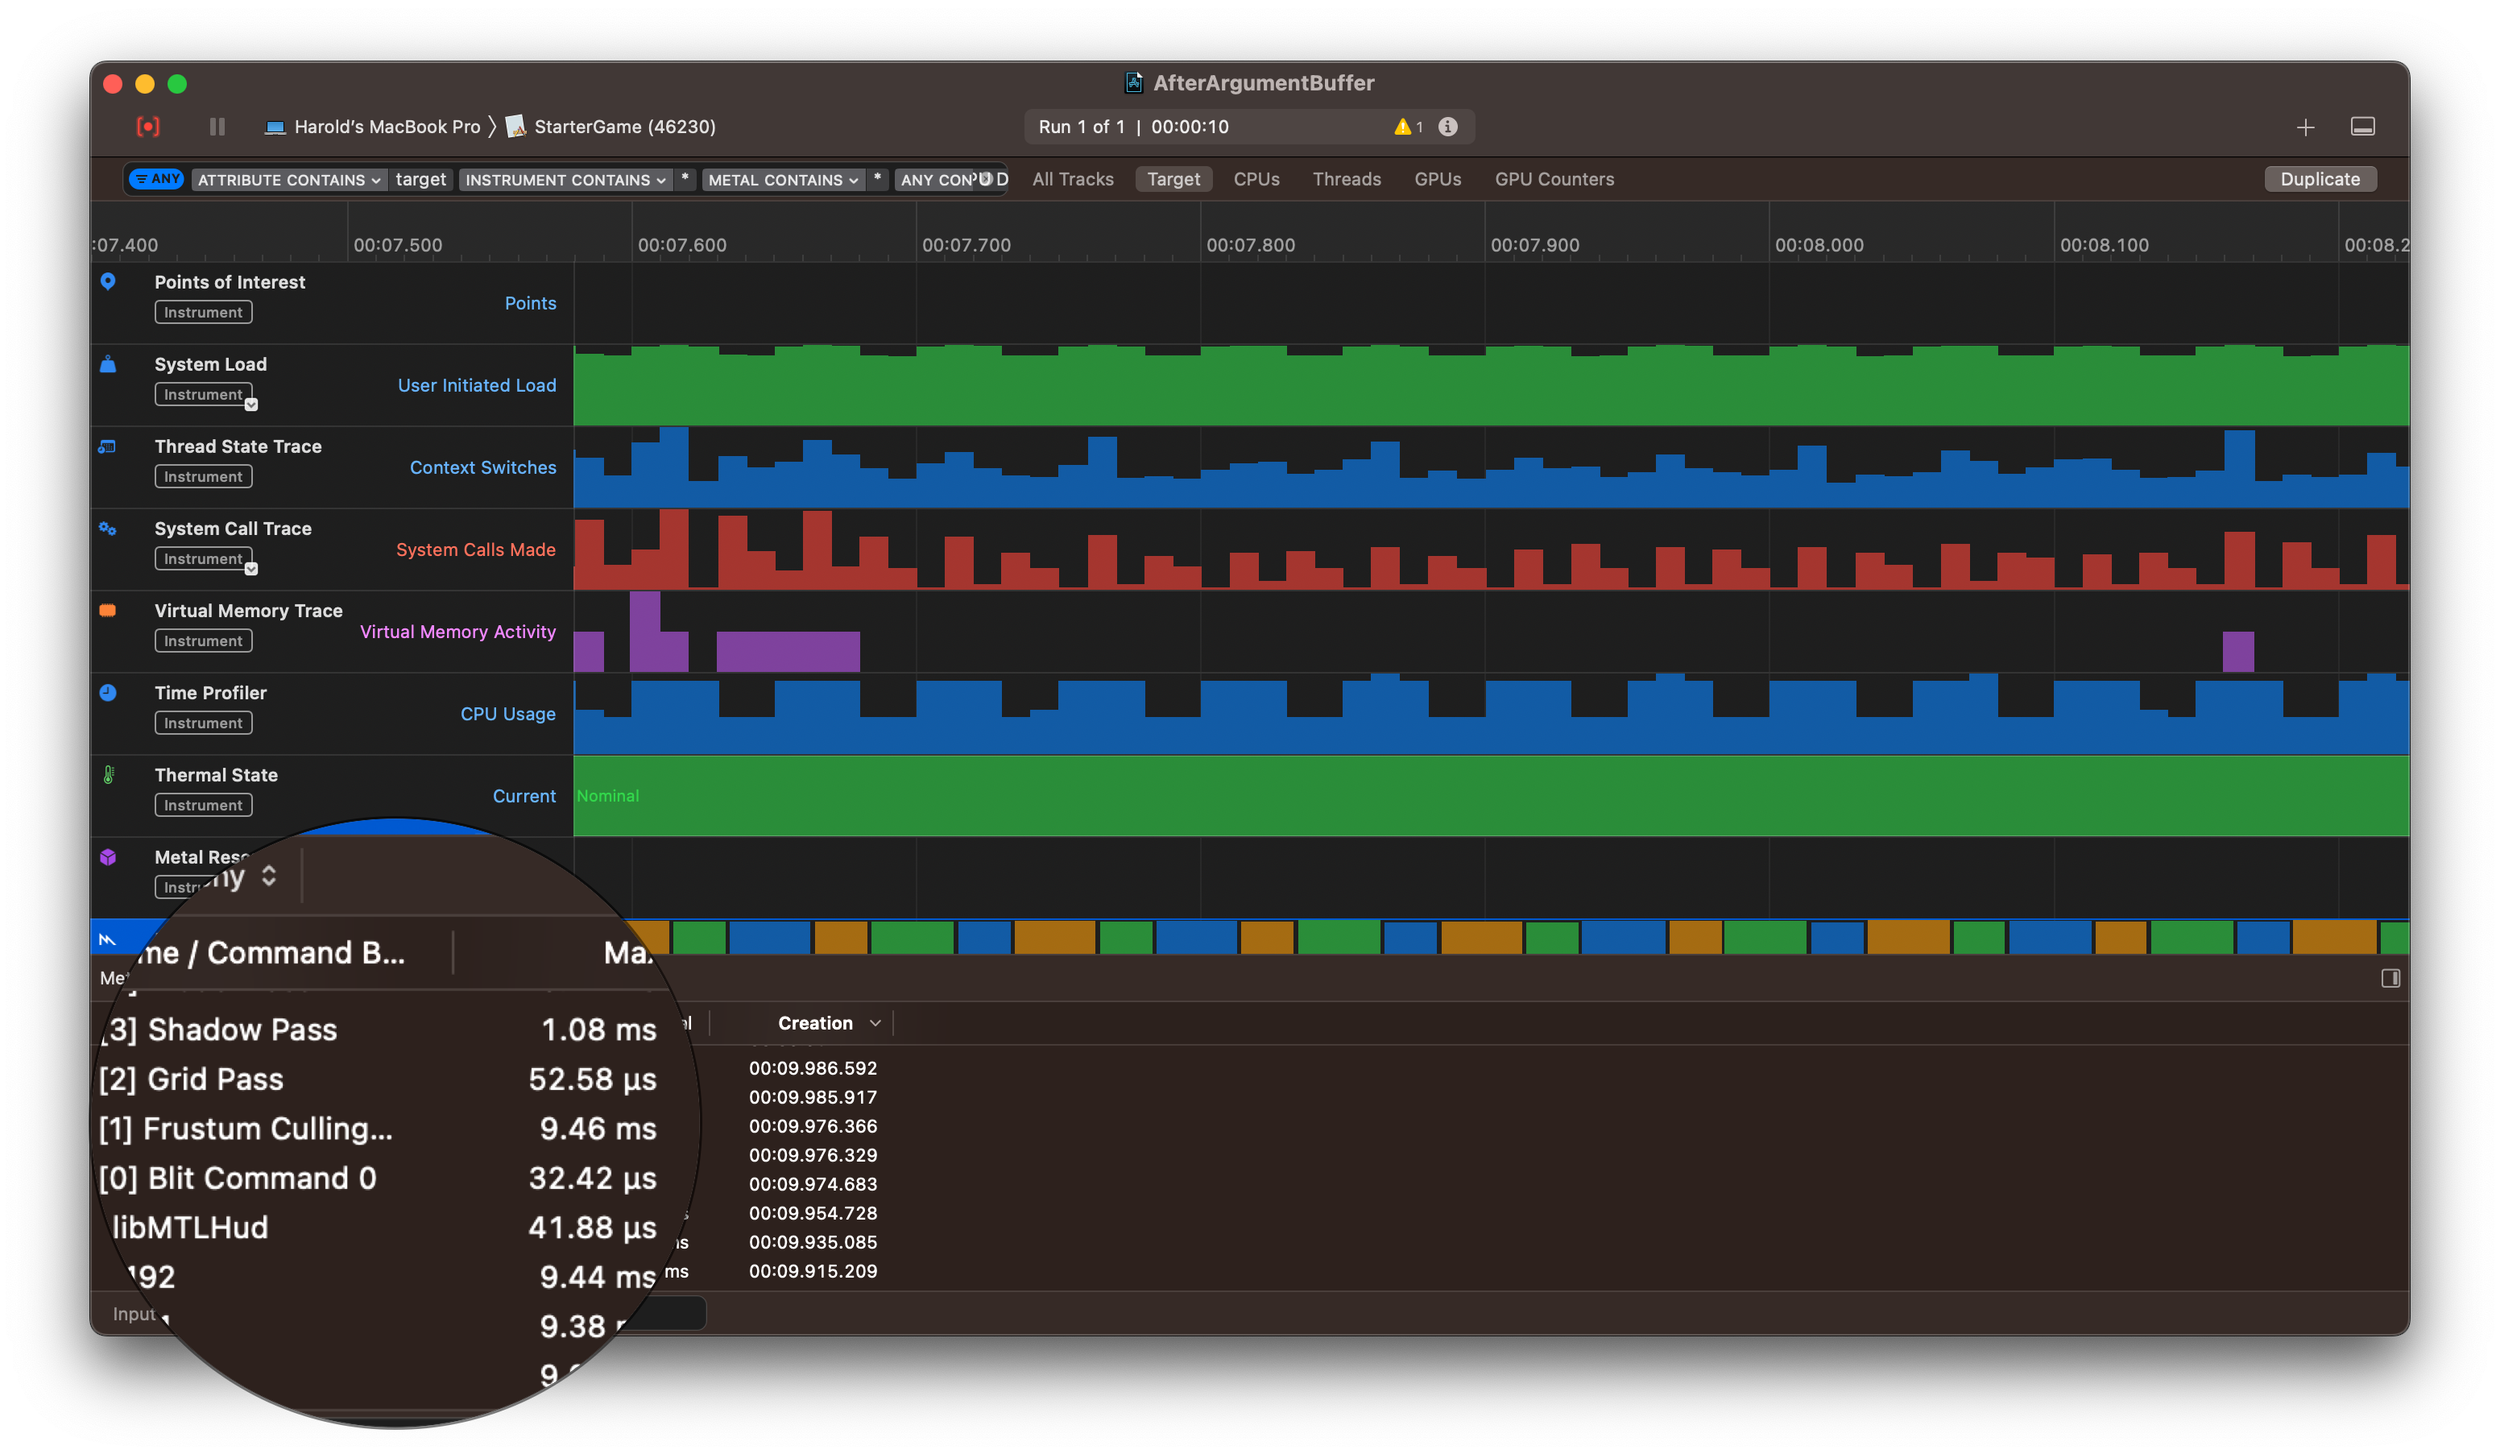
Profiling with Xcode Instruments pointed the finger at Metal’s encoder preparation, which appeared to take ~15 ms. Based on that, my next move seemed obvious: switch to a bindless rendering.

What does that mean? Instead of rebinding textures and material properties for every draw call, I would move everything into a single argument buffer. Each draw would reference materials by index. In theory, this should drastically cut CPU overhead and pair nicely with GPU-driven culling.

But reality didn’t match theory. After spending days moving to a bindless model, I ran the engine with 500 models — and the performance needle didn’t budge. In fact, things got worse: encoder prep time increased from ~15 ms to ~17 ms.

You can imagine my disappointment. But I kept digging. And then I found the real bottleneck. Instruments showed the CPU was spending almost 9.5 ms just preparing data for GPU frustum culling.

So the encoder wasn’t the problem after all. As I dug into the code, I discovered the true culprit: a single function that queries all entities with specific component IDs.


Here’s what was happening:

👉 My component mask was stored as an array of 64 booleans. Every time I checked an entity, the code looped through all 64 slots, read from two arrays, and branched on each one. With 500 entities, that meant tens of thousands of tiny checks every single frame. No wonder the CPU was choking.

The fix? Replace the boolean array with a single 64-bit integer and use a bitwise AND. That collapses the entire check into just two instructions. Here’s the new function:


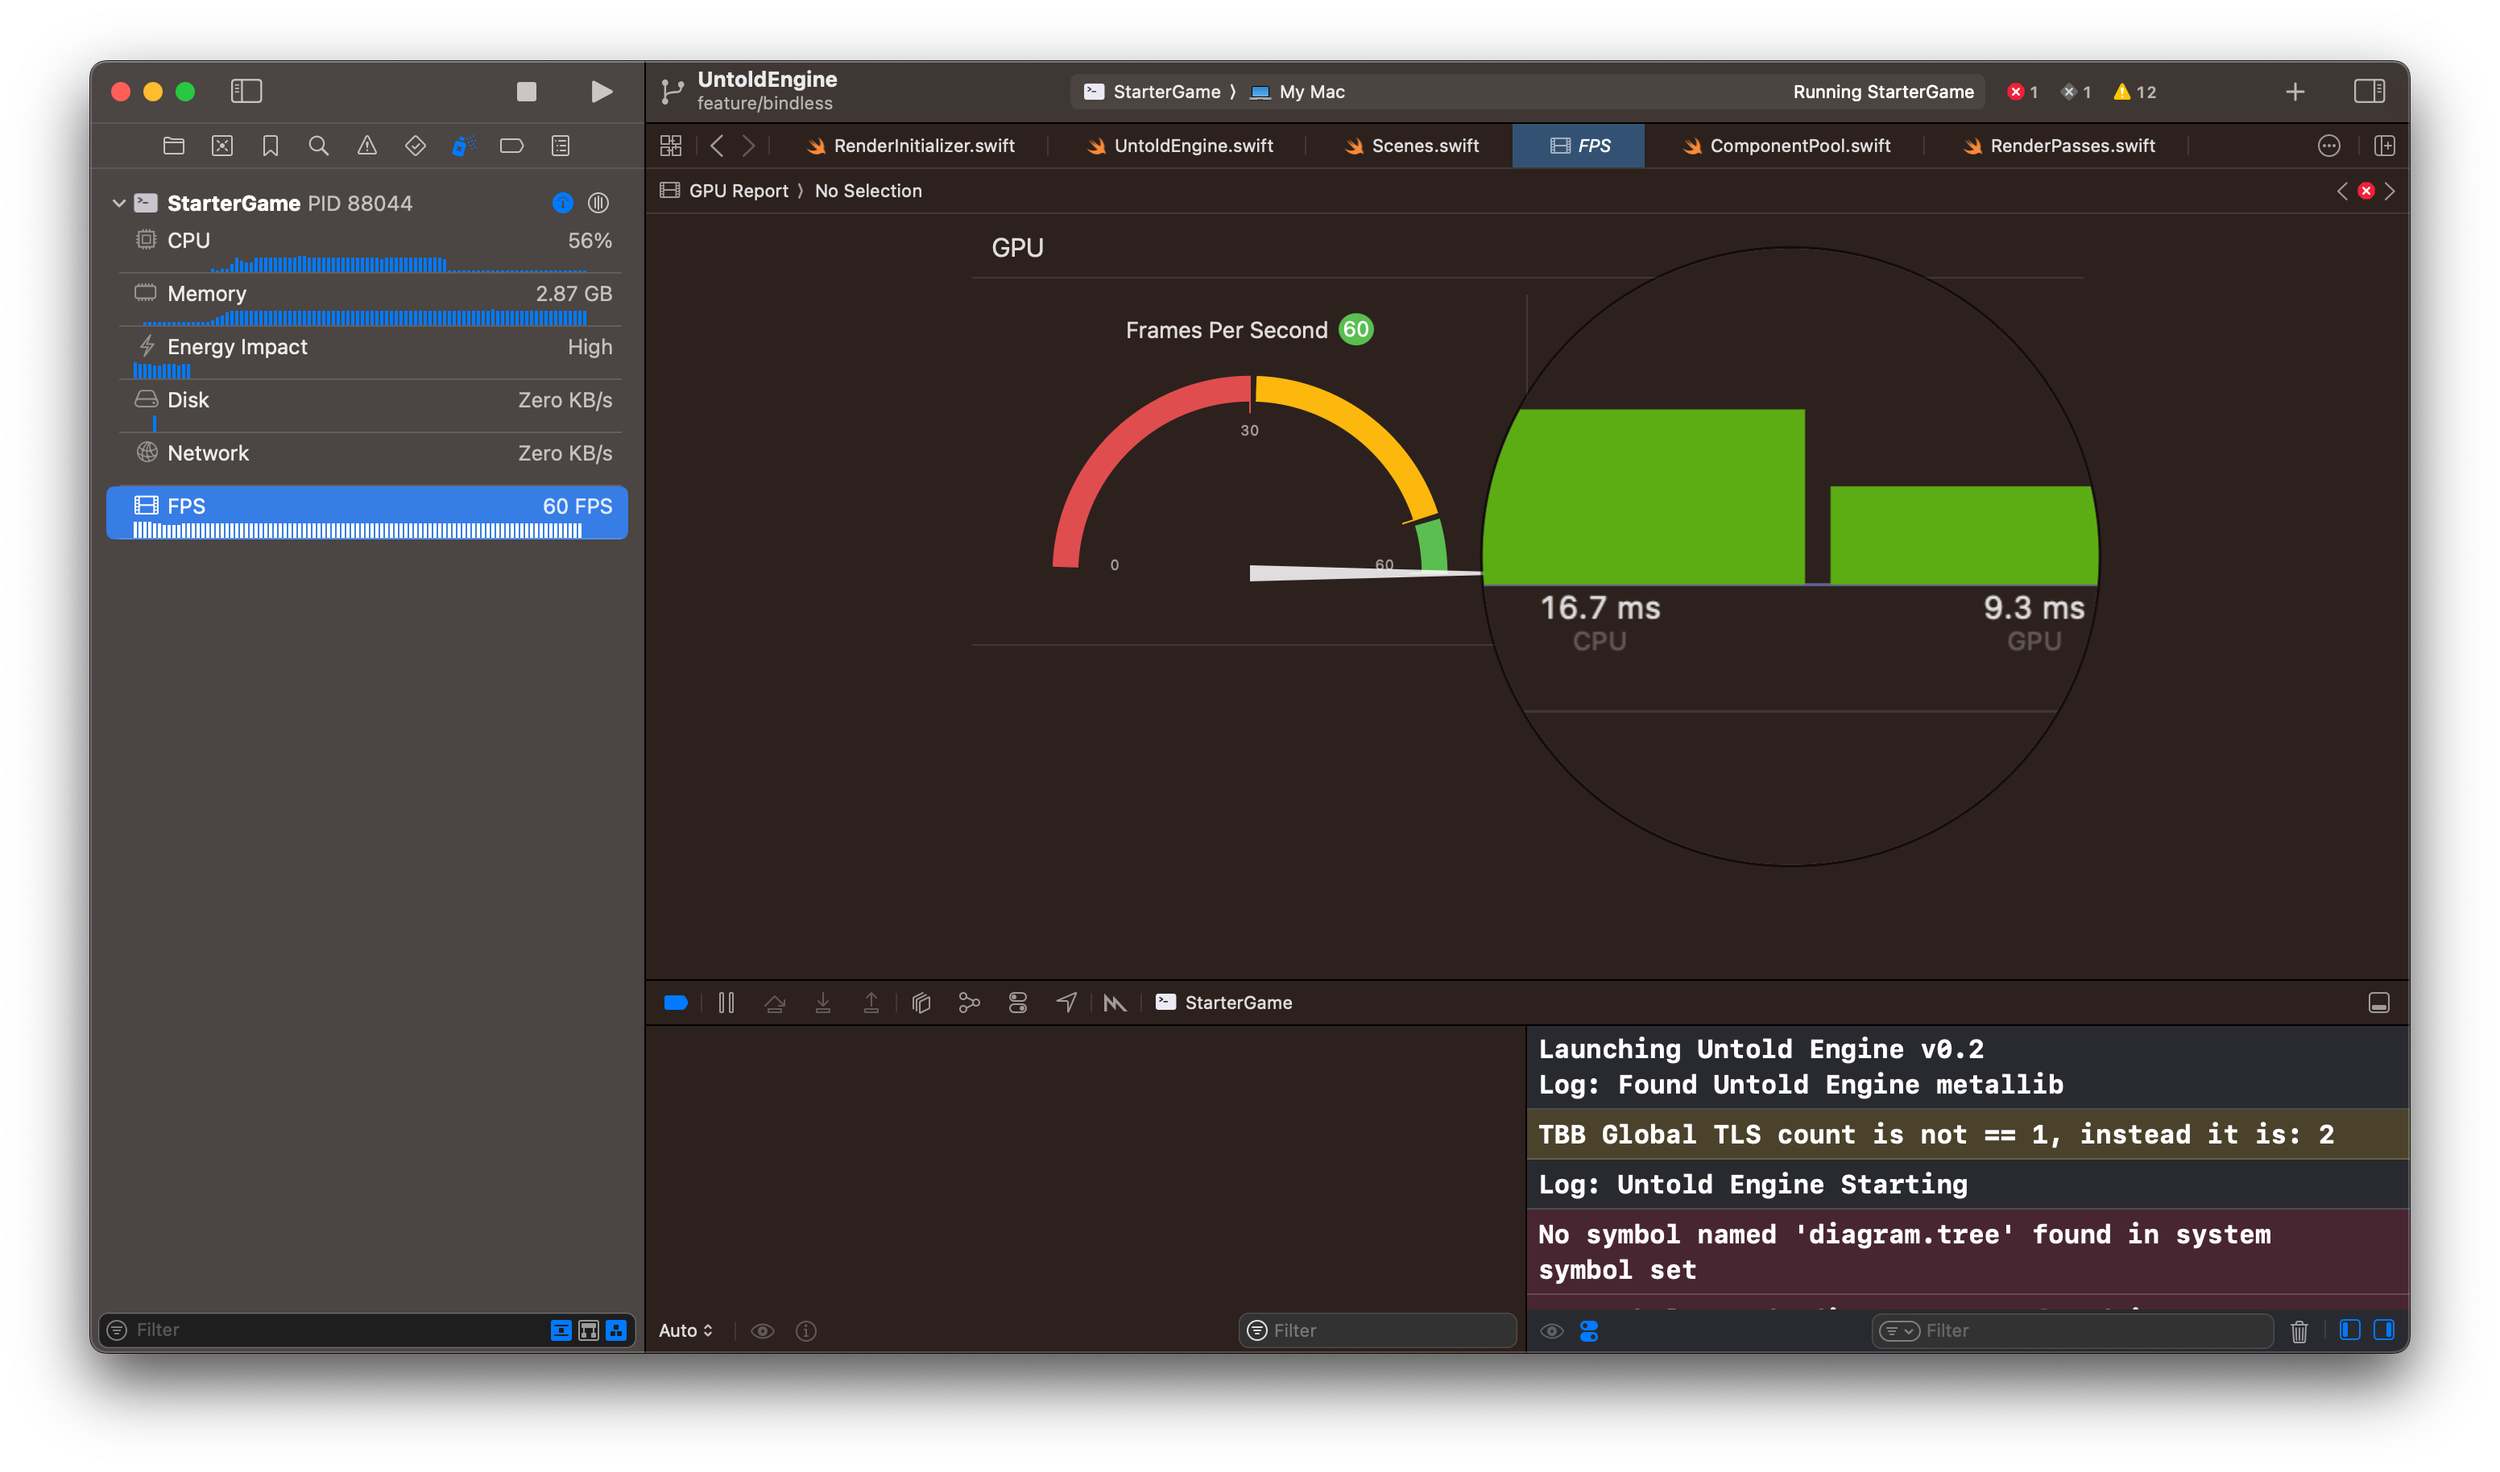
That one change dropped the CPU frame time from 26.7 ms down to 16.7 ms. The GPU frame time sits at 9.3 ms.

In other words, the engine now runs at a solid 60 fps.

I’m happy with the results: the engine is no longer CPU-bound or GPU-bound.

But I’m not done yet. The next step is implementing occlusion culling — and I’m excited to see how far I can push performance.

Thanks for reading.

Optimizing My Engine’s Light Pass: Lessons from GPU Profiling

Now that the Untold Engine has most of the features that make it usable, I wanted to spend the next couple of months focusing on performance.


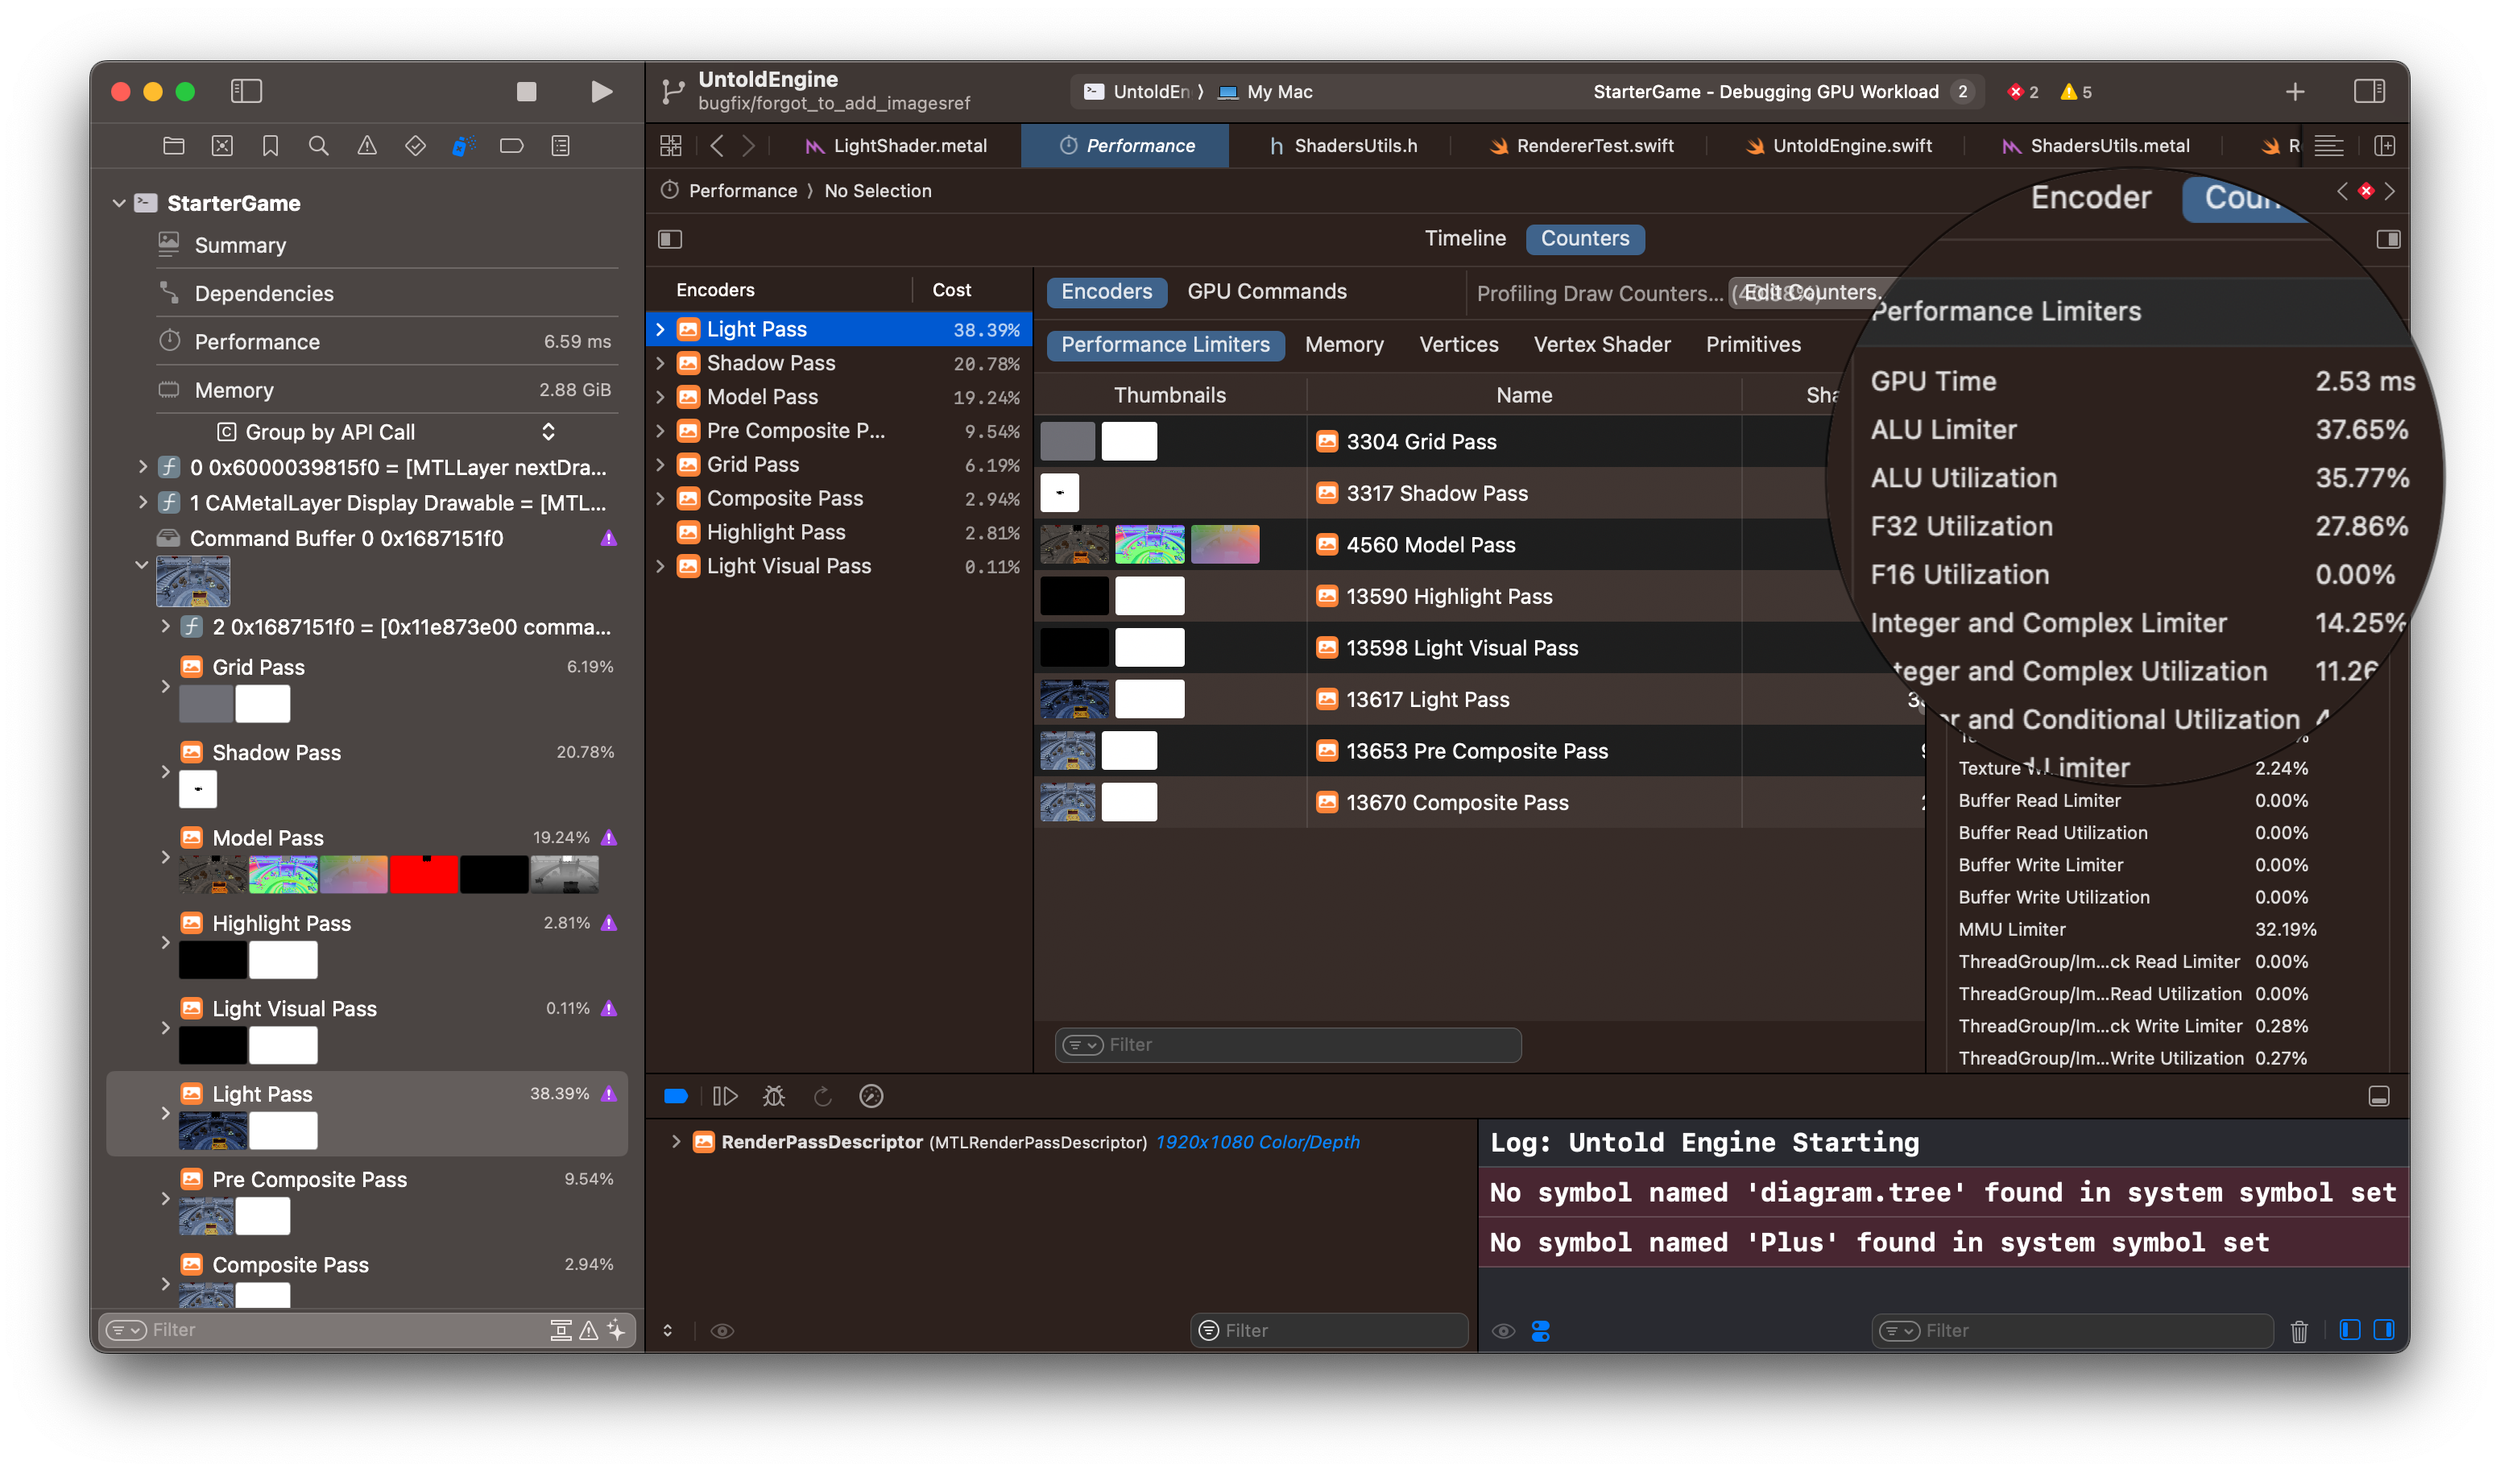
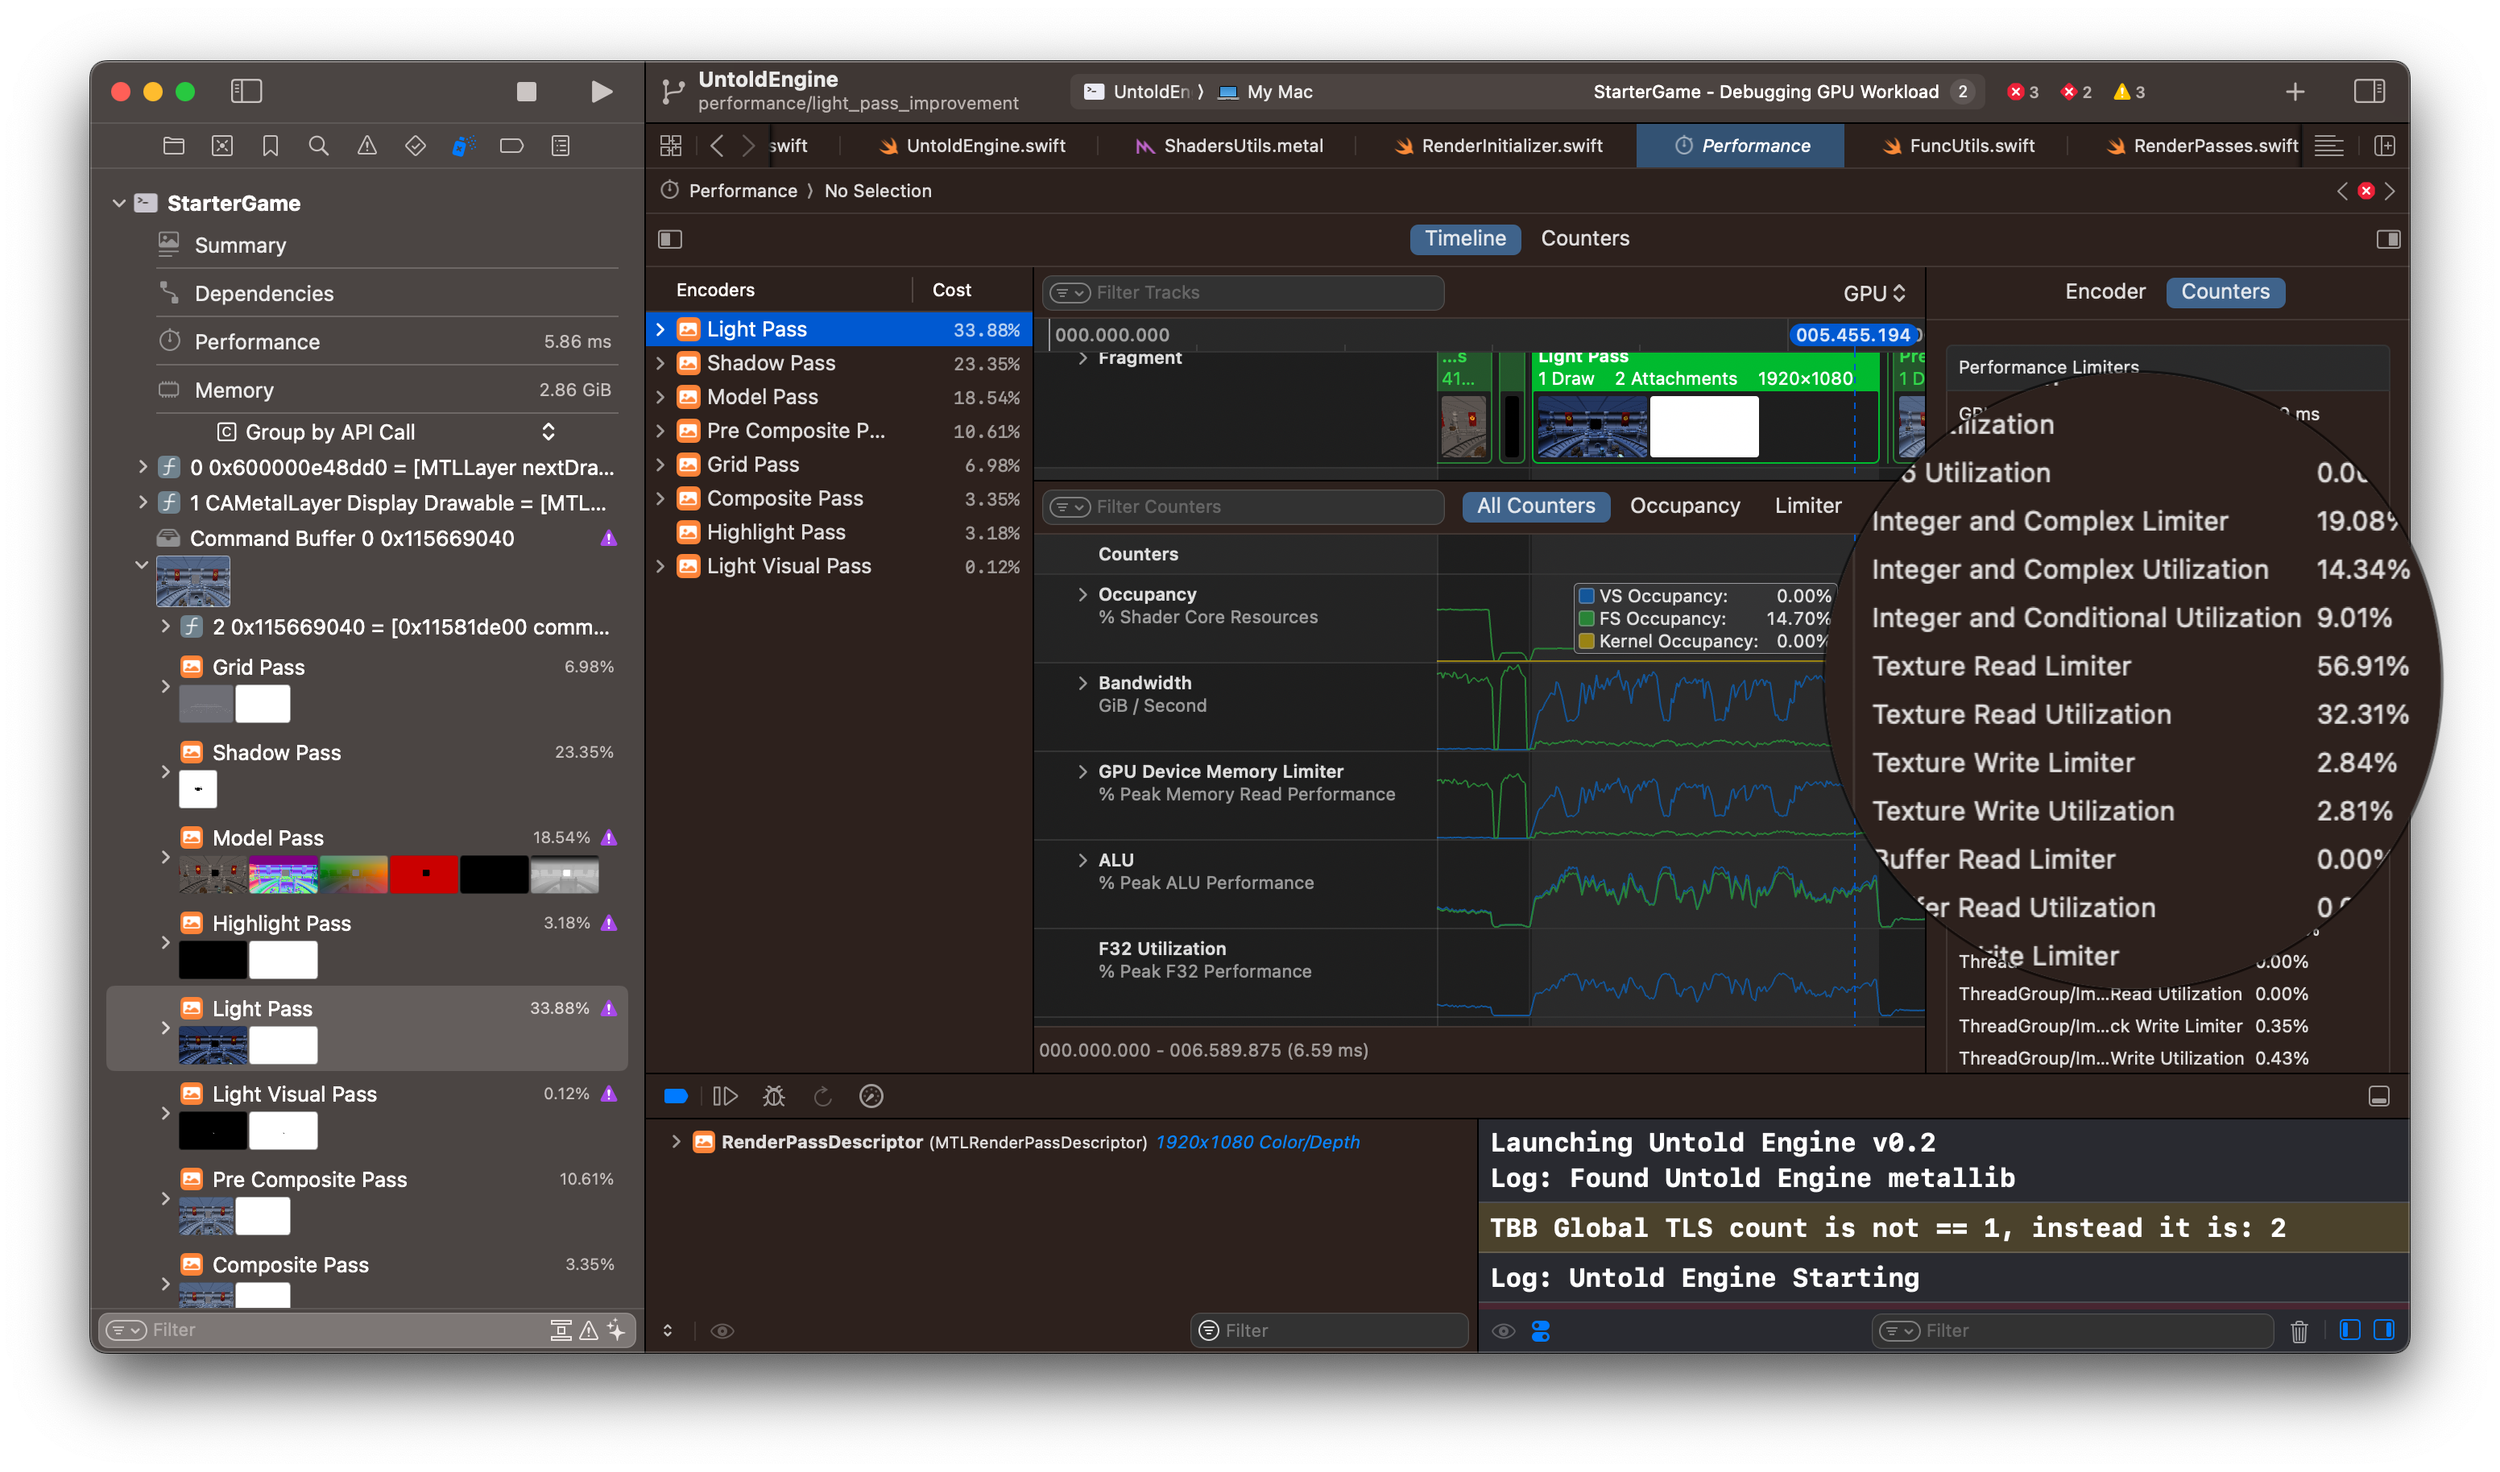
I decided to start with the Light Pass. For testing, I loaded a scene with around 214,000 vertices. Not a huge scene, but enough to get meaningful profiler data. After running the profiler, these were the numbers for the Light Pass:

  • GPU Time: 2.53 ms
  • ALU Limiter: 37.65%
  • ALU Utilization: 35.77%
  • Texture Read Limiter: 57.8%
  • Texture Read Utilization: 26.83%
  • MMU Limiter: 32.19%

The biggest limiter was Texture Read, at almost 58%. This means the GPU was spending a lot of time fetching data from textures—likely because they weren’t being cached efficiently. In hindsight, I should have started by tackling the biggest limiter. Instead, I first focused on improving the MMU. Not the best choice, but that’s how you learn.

MMU Limiter means your GPU performance is constrained by memory address lookups and fetches, not arithmetic.

Optimization 1: Buffer Pre-Loading

Buffer pre-loading combines related data into a single buffer so the GPU can fetch it more efficiently, instead of bouncing between multiple buffers. In my original shader, I was sending light data through separate buffers:

constant PointLightUniform *pointLights [[buffer(lightPassPointLightsIndex)]]

constant int *pointLightsCount [[buffer(lightPassPointLightsCountIndex)]]

I restructured this into a single struct that packages light data together. This change reduced the MMU Limiter from 32.19% → 26.43%.

Optimization 2: Use .read() Instead of .sample()

During the Light Pass, I fetch data from multiple G-buffer textures such as Position, Normal, Albedo, and SSAO. Originally, I used .sample(), but this does more work than necessary—it applies filtering and mipmap logic, which adds both memory traffic and math. Switching to .read() (a direct texel fetch) gave a noticeable improvement:

  • Texture Read Limiter: 57.8% → 46.79%
  • Texture Read Utilization: 26.83% → 30.03%

Optimization 3: Reduce G-Buffer Resolution

Next, I reduced the G-Buffer textures from float to half. I expected this to lower bandwidth usage, but to my surprise it made things worse:

  • Texture Read Limiter: 46.79% → 56.9%
  • Texture Read Utilization: 30.03% → 32.31%

Sometimes optimizations backfire, and this was one of those cases.

Optimization 4: Half-Precision Math in Lighting

I then focused on ALU utilization by switching parts of my lighting calculations to use half-precision (half) math. Specifically:

  • Diffuse contribution → half precision
  • Specular contribution → full precision (float)

The results were underwhelming:

  • ALU Limiter: 37.65% → 37.55%
  • ALU Utilization: 35.77% → 35.83%
  • F32 Utilization: 27.86% → 25.12%
  • F16 Utilization: 0% → 1.11%

Half-precision math showed up in the counters, but didn’t change the overall bottleneck.

Final Results

Here’s the overall improvement from all the optimizations:

Before → After

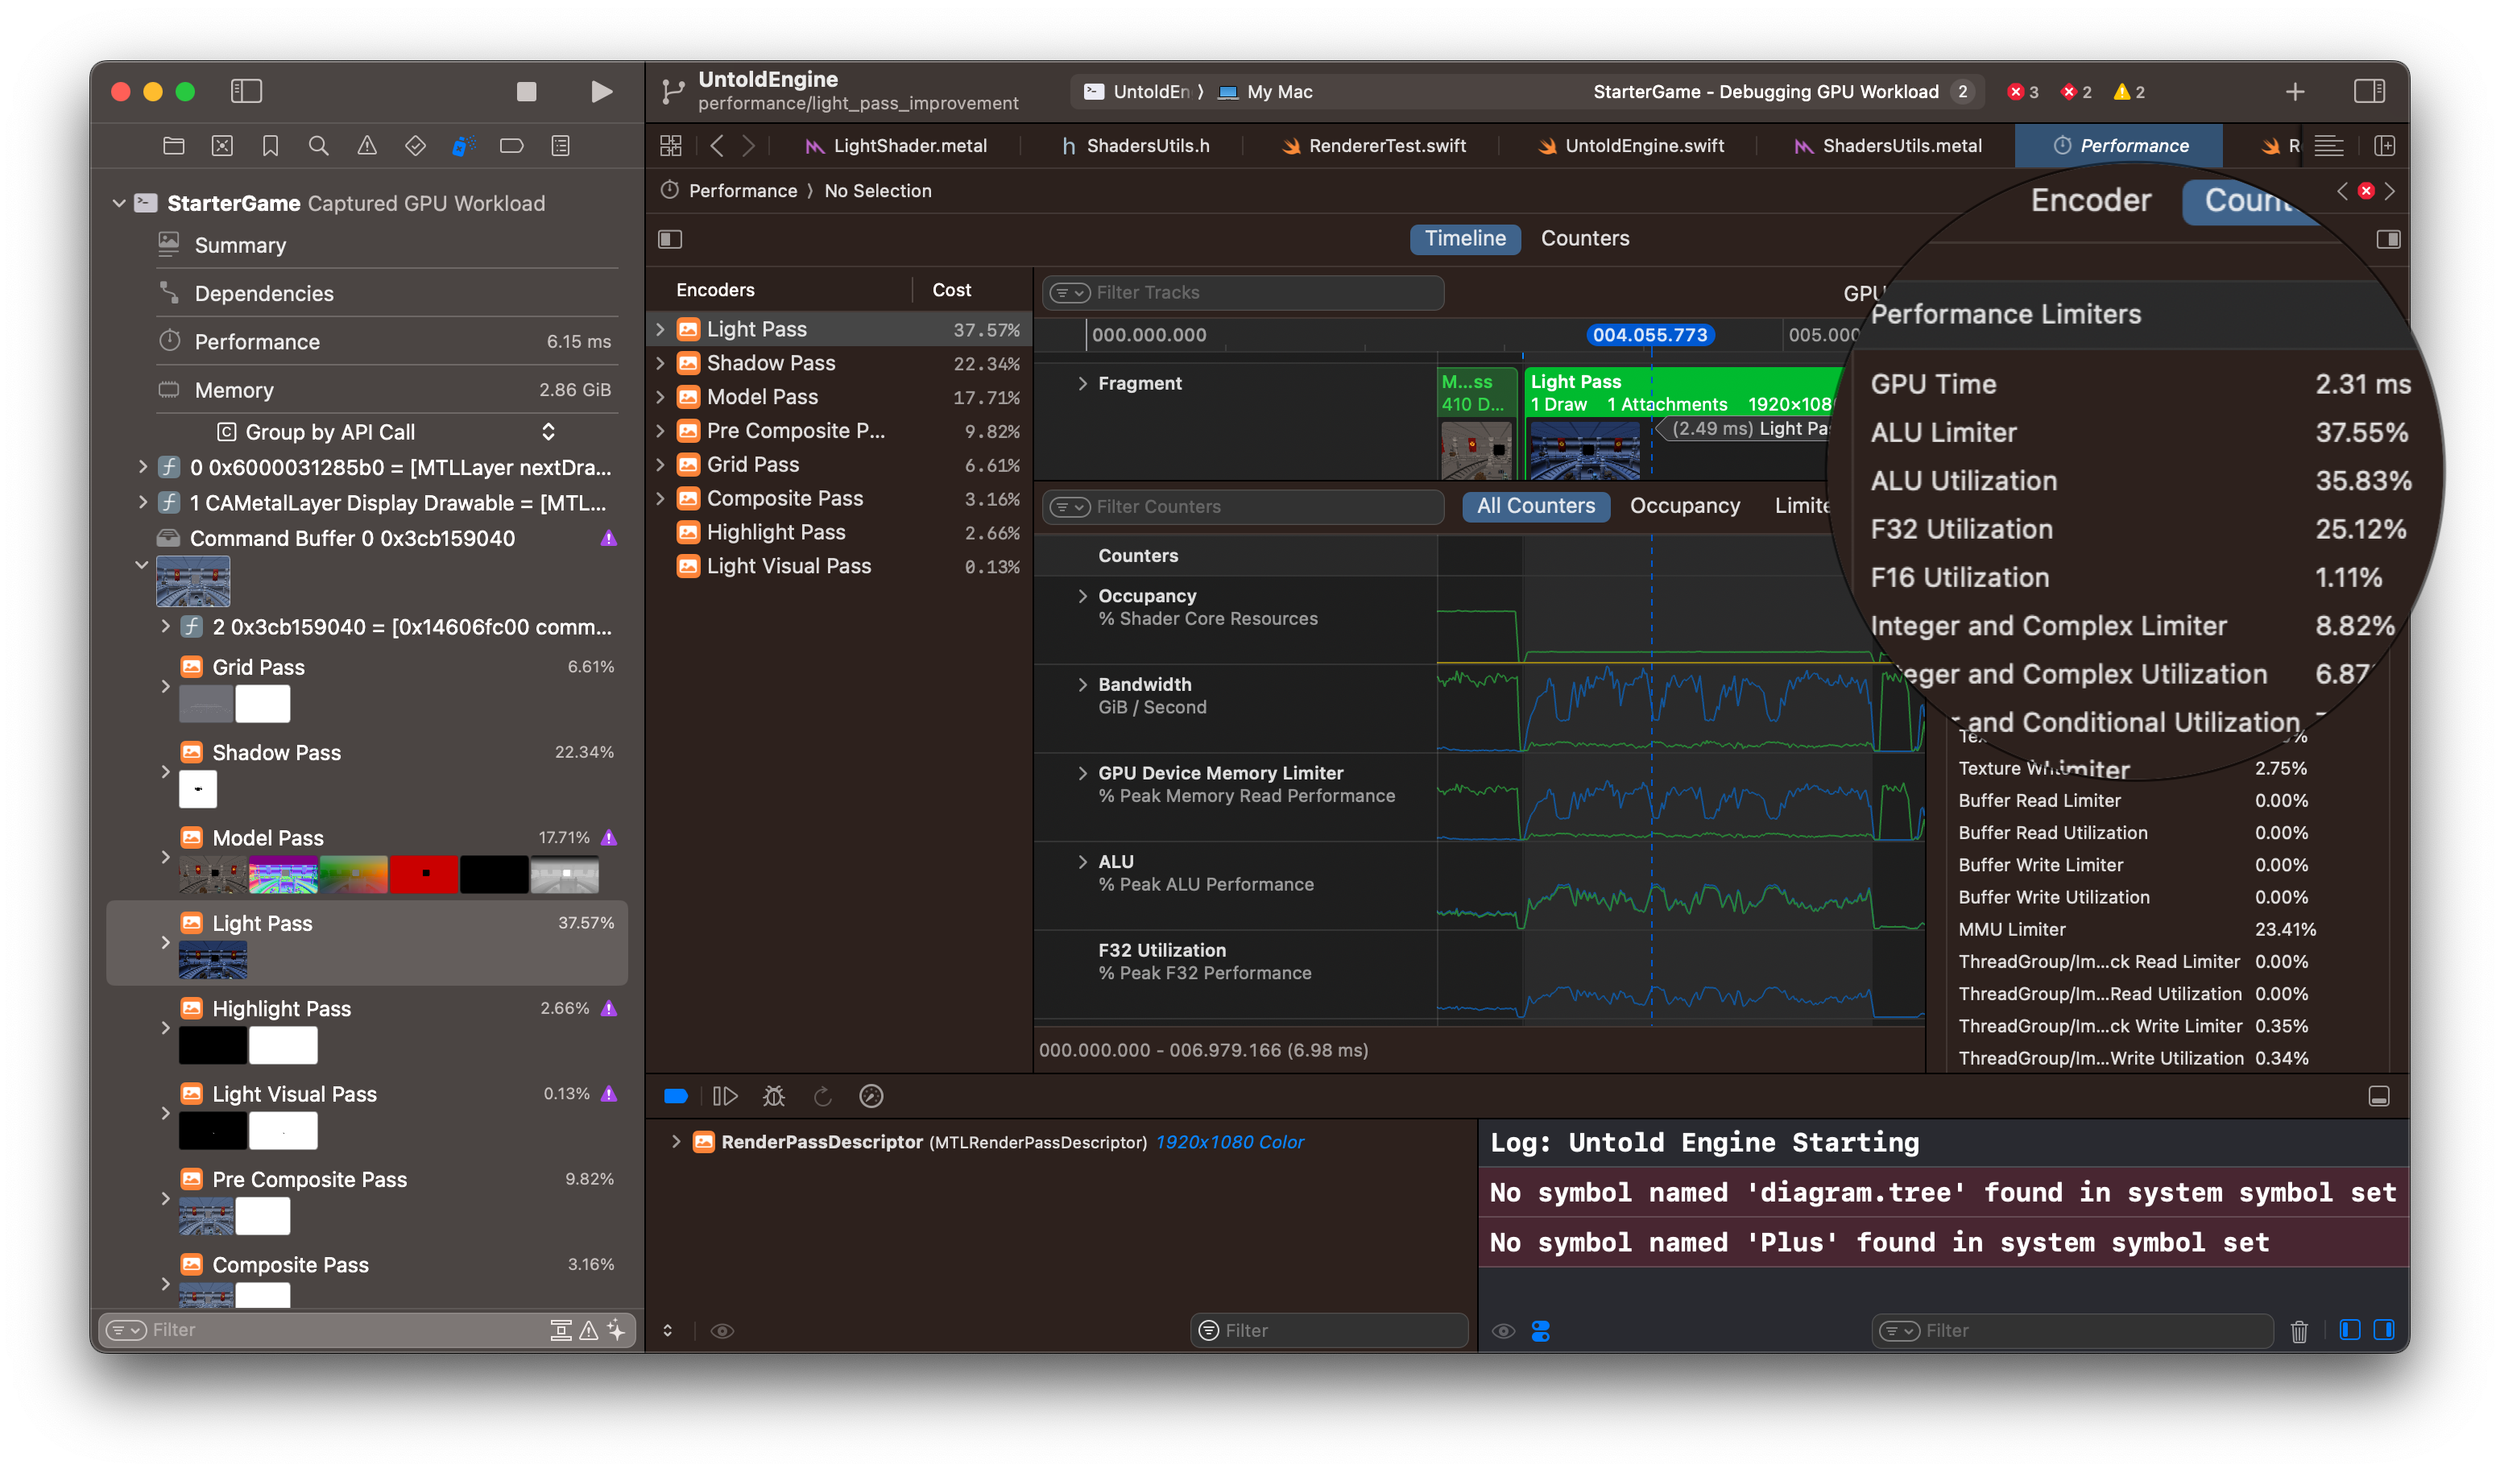
  • GPU Time: 2.53 ms → 2.31 ms (~8.7% faster)
  • Texture Read Limiter: 57.81% → 50.93%
  • MMU Limiter: 32.19% → 23.41%
  • ALU Limiter: 37.65% → 37.55% (flat)
  • F32 Utilization: 27.86% → 25.12%
  • F16 Utilization: 0.00% → 1.11%
  • Integer & Complex Limiter: 14.25% → 8.82%
  • Texture Read Utilization: 26.83% → 31.62%

What the Numbers Say

  • I shaved about 9% off the Light Pass—a real improvement, but not dramatic.
  • The biggest wins came from reducing memory-side pressure (MMU ↓, Texture Read Limiter ↓).
  • ALU stayed flat, which shows the pass is still memory/texture-bound, not math-bound.
  • Half-precision math registered, but didn’t help much since math wasn’t the bottleneck.
  • Removing unnecessary integer/complex math improved things locally, but again, the frame was dominated by texture fetch bandwidth.

Takeaway

Optimizations don’t always yield big wins, but each attempt brings clarity. In this case, the profiler clearly shows that the Light Pass is memory/texture-bound. My next steps will focus directly on reducing texture fetch cost, rather than trimming ALU math.

Thanks for reading.

How SSAO Instantly Improved My Engine’s Visuals

In this video, you’ll see:

  • Before/after comparisons of SSAO in action
  • A quick explanation of how SSAO works
  • Why it’s worth adding to your renderer
  • How I integrated it into my lighting pipeline


If you're building your own engine or renderer, or just want to level up your graphics knowledge, this one's for you.

Enjoy.

Progress, Not Perfection: How I Work on My Game Engine Daily

I took several months off from Youtube to focus entirely on improving the Untold Engine renderer, and it has paid off.


Through sheer work and pushing myself everyday, I have managed to add several features to the renderer such as:

  • Multiple light types: Spot and Area lights
  • Gizmo tools to translate, rotate and scale
  • Post-processing shaders such as: Depth of field, Chromatic Aberration, Bloom, Color Grading, White Balance, Vignette effects.
  • Gizmo tools to manipulate light meshes
  • Improved Editor's user experience

Overall, the renderer feels more complete. While setting up your scene, you can manipulate the position, orientation and scale of each model through the use Gizmo tools. If curious, you can get a quick look at the different PBR textures attached to your model, and if desired, you can update them as well.
If desired, you can add any of the four types of lights into your scene: Directional, Point, Spot and Area light. And you can modify their direction by simply dragging the gizmo tool.

Once your scene is ready, you can add several Post-processing effects as mentioned above. Each effect's properties can be manipulated through the editor and you get visual feedback of the effect.

I feel very proud of the stage of the renderer. I fixed several bugs in the renderer and while fixing each bug; I learned a lot more than I expected. However, working on the renderer daily was hard. Between my full-time job and my beautiful family, I was able to spare an hour or so on the renderer. Every day, I had to force myself to wake up before my kids did, so I can focus on getting some work done, even when my energy level was close to zero. Somehow, I managed to get the renderer to its current state, and it is something I feel proud of.

There are several issues with the Renderer and that is OK, because everyday I wake up with the idea that I will make the engine a bit better than it was the day before, and I'm convinced that this mindset will take the engine to the next level.