Debugging a Flickering Issue Caused by Asynchronous Culling

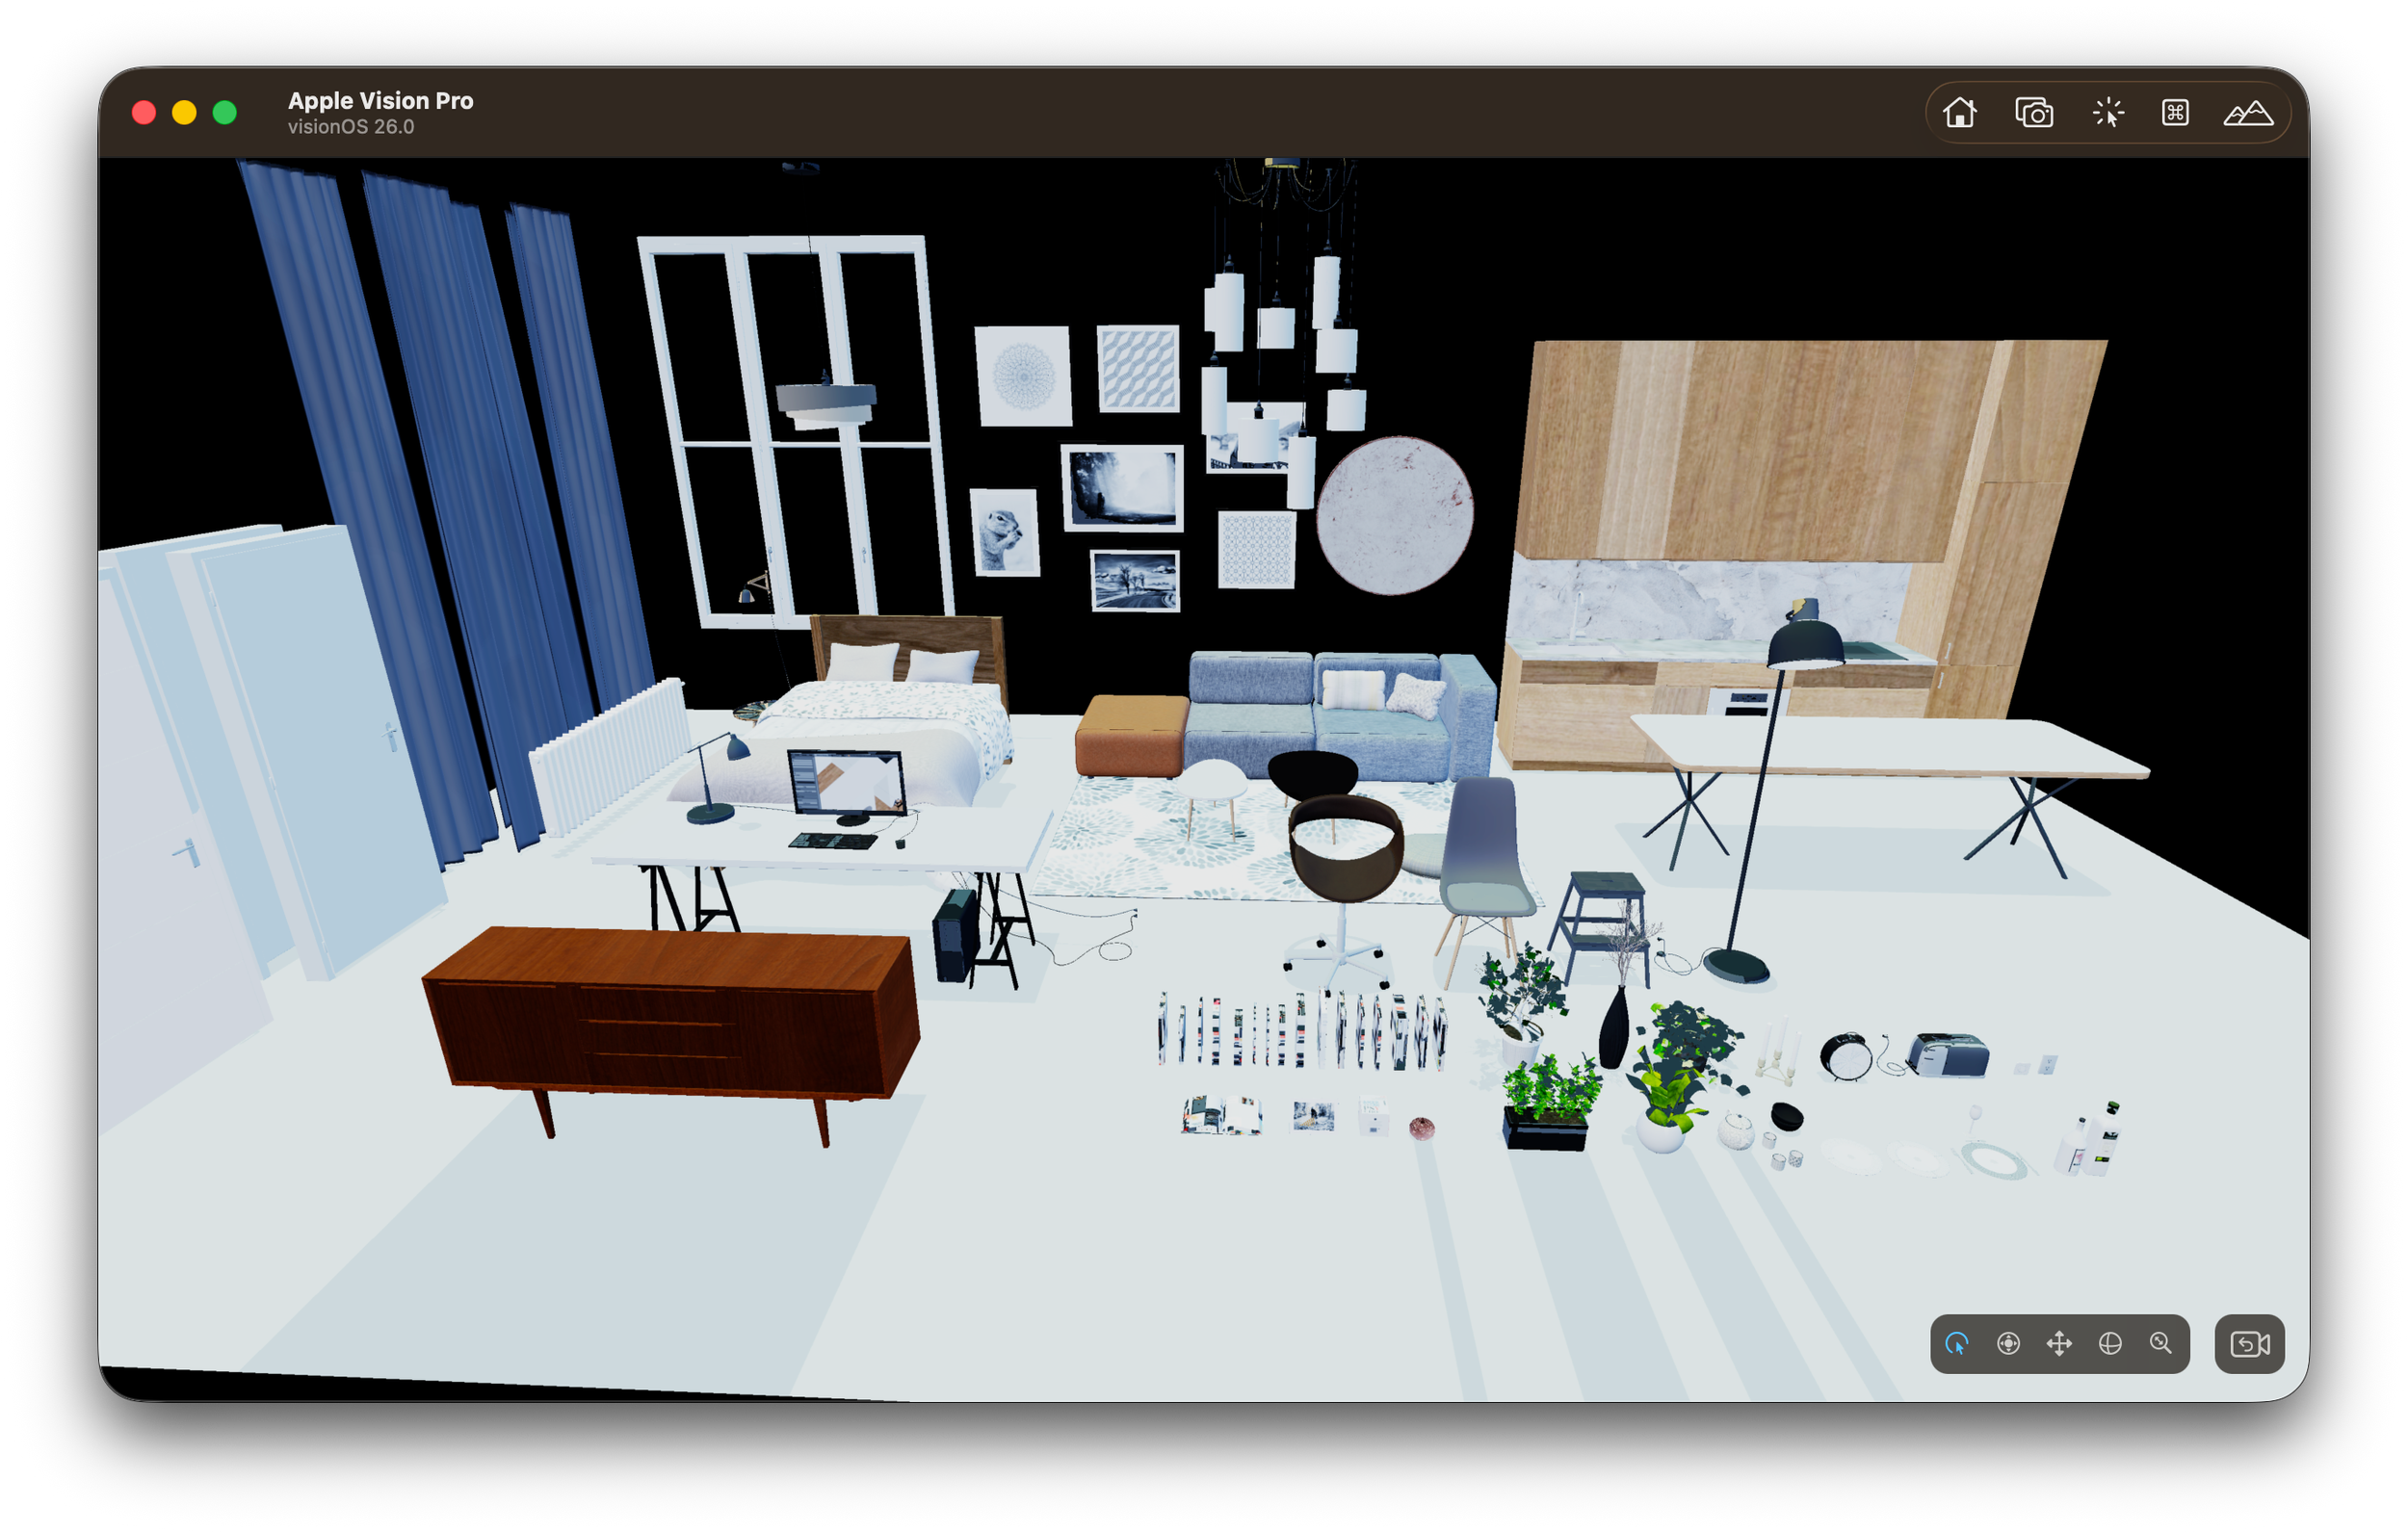
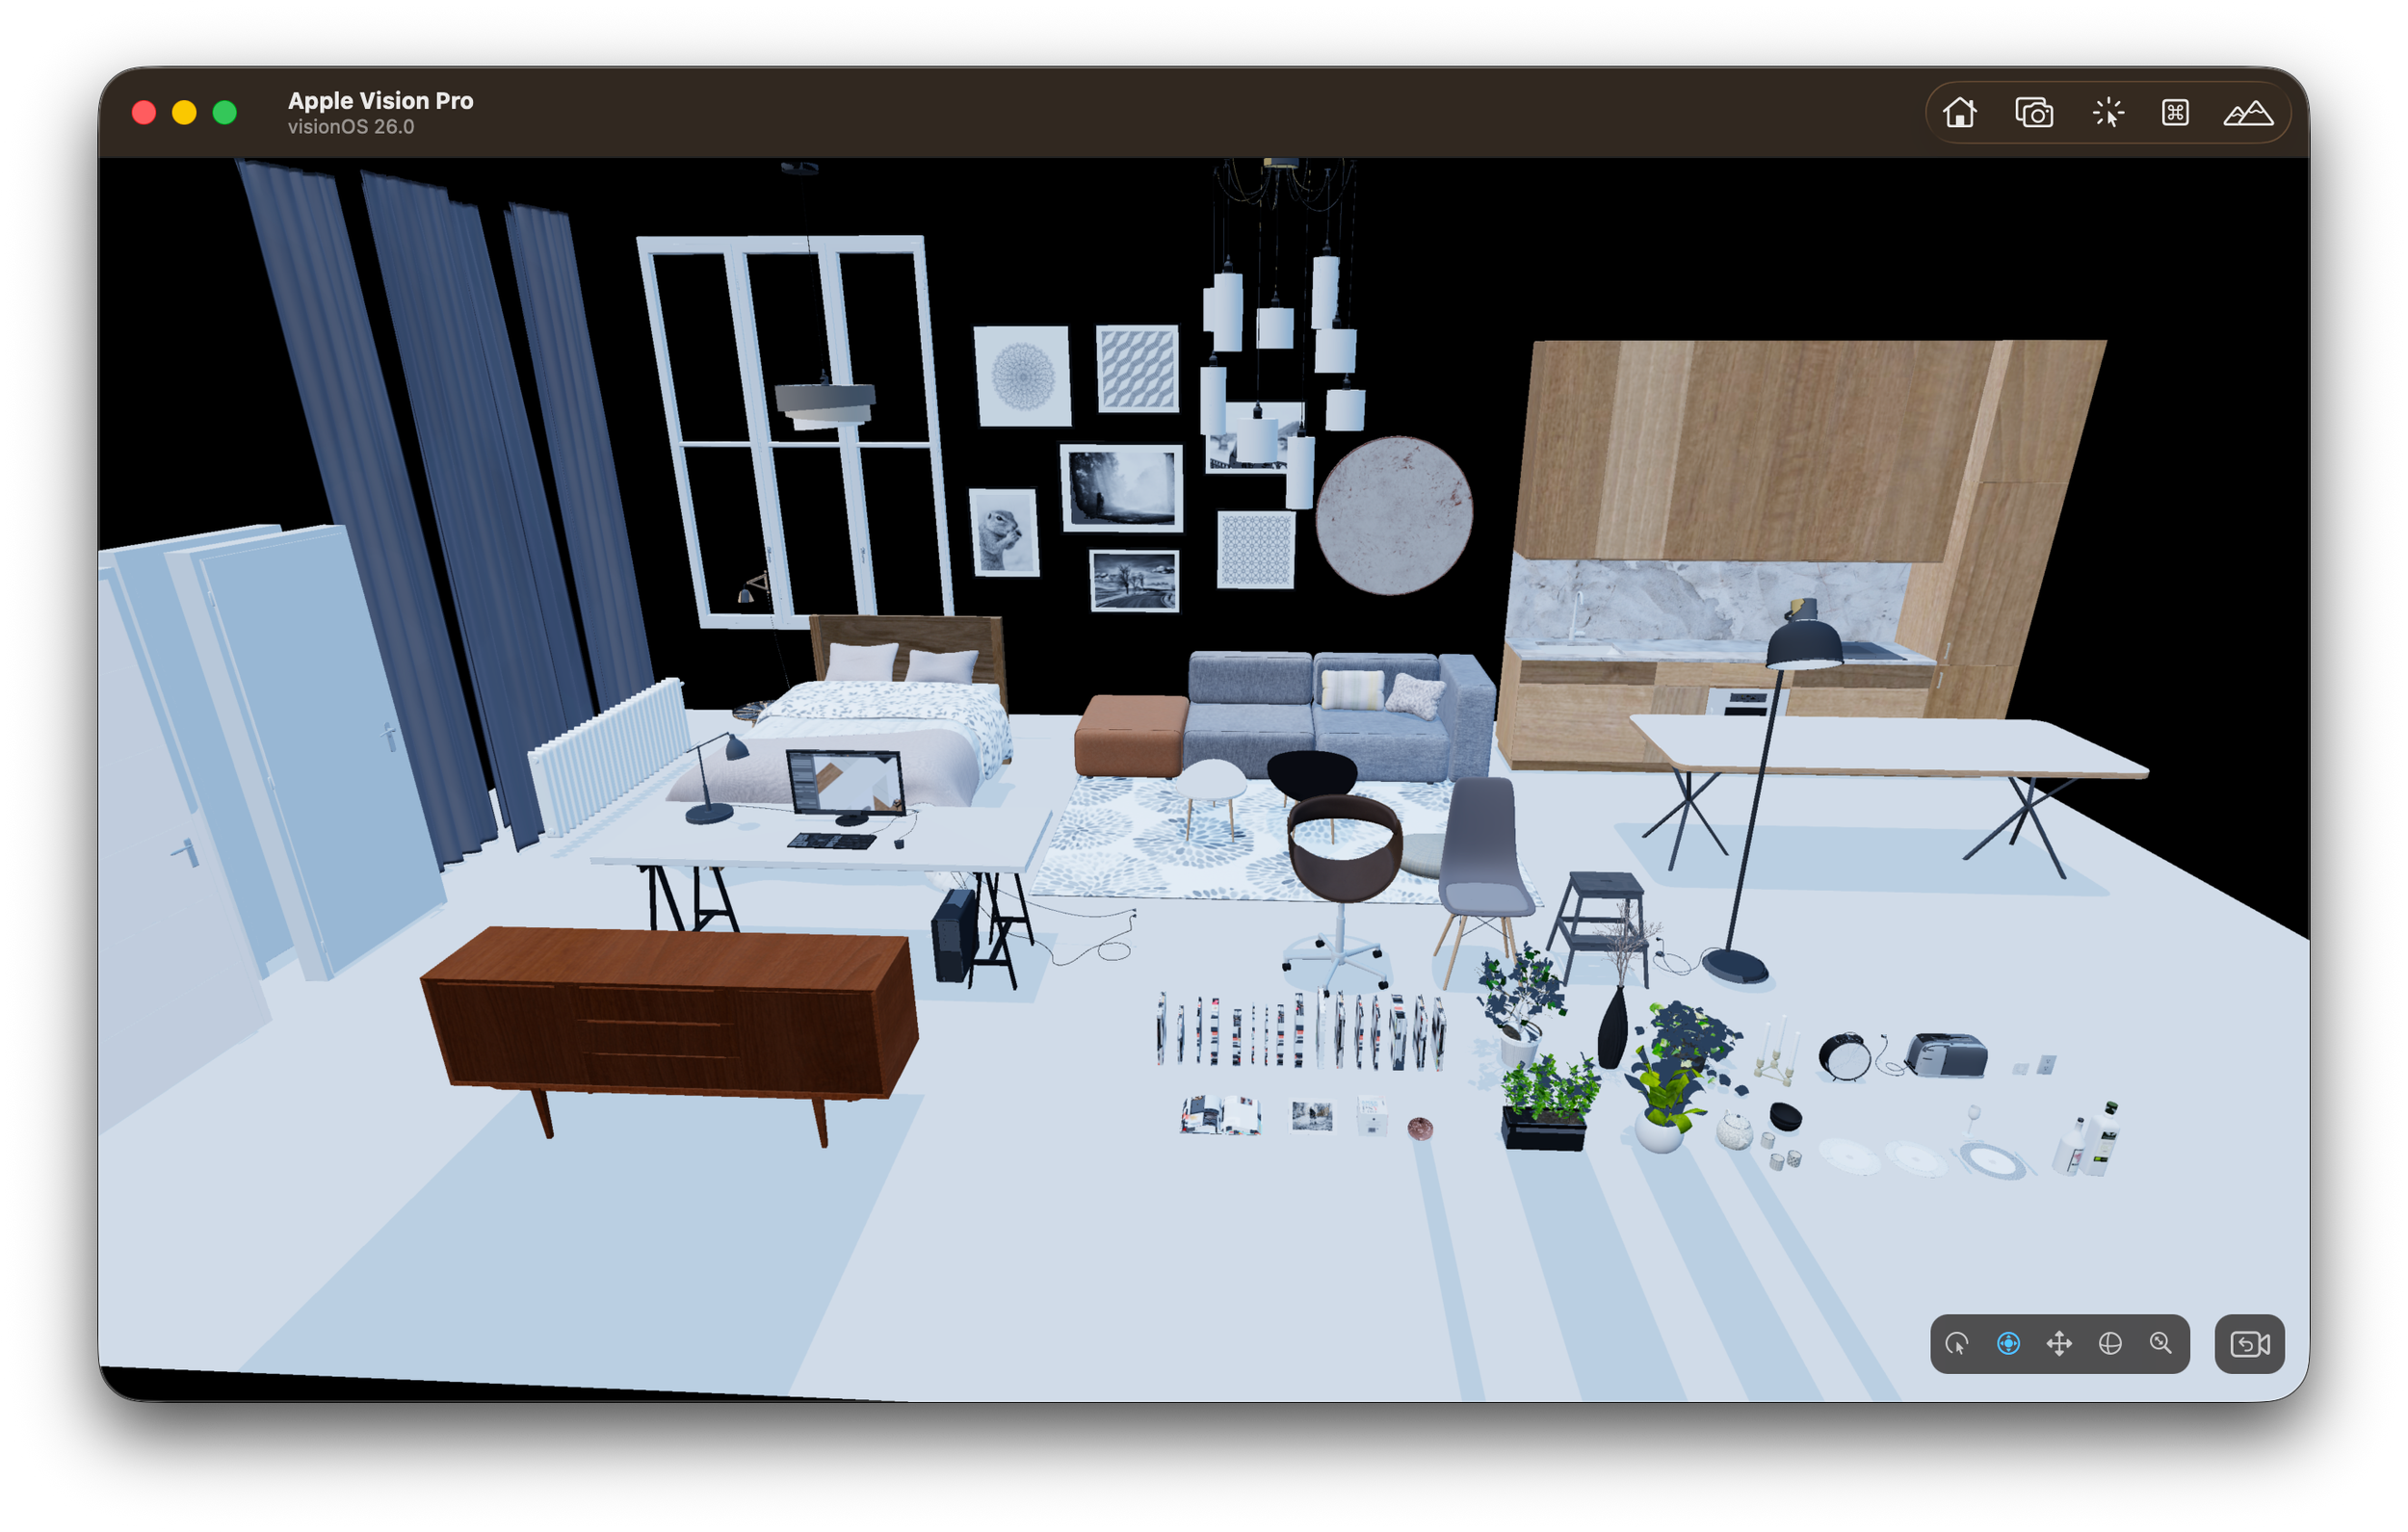
After implementing frustum culling in the Untold Engine, performance improved, but right away I noticed flickering. It didn’t happen every frame, but it was noticeable whenever most of the models were in view.

So, I opened up Instruments to profile the issue. I noticed warnings that the engine was holding on to the drawable too long. I tried restructuring things to hold on to the drawable for as short a time as possible, but nothing helped.

According to Instruments, the engine was not CPU-bound or GPU-bound. There was no clear indication of the root cause of the flickering.


Digging Deeper

At that point, I decided to record a short video of the issue. I slowed it down and went frame by frame. What I saw wasn’t the usual kind of flickering—it was different.

  • Frame 1: a certain set of models was visible.
  • Frame 2: a completely different set was visible.
  • Frame 3: some disappeared, others suddenly appeared.

Models were popping in and out, almost as if something was out of sync.

This was a huge hint: it looked like a data race.


The Culprit

Looking at the code confirmed it.

In the frustum culling command buffer completion handler, I was updating the visibleEntityId array. This array held all the entities that passed the culling test.

The problem was that the GPU calls this completion handler asynchronously, while the CPU was already using that same array during the rendering passes (shadow and geometry).


In other words, the CPU was iterating over visibleEntityId at the same time the GPU might be modifying it.

Classic data race.


The Fix: Triple Buffering

The solution was to add a triple-buffered visible entity list.

During culling, the GPU writes results into buffer n+1.


During rendering, the CPU continues to read from buffer n.


When the frame finishes and the render command buffer’s completion handler triggers, I update the index so the CPU reads from the freshly written buffer n+1 on the next frame.

This guarantees that the CPU never reads data being modified by the GPU. The renderer always sees a stable snapshot of the visible entities.


The Result

With triple buffering in place, the flickering disappeared instantly. Models no longer popped in and out between frames.

This bug was a good reminder: sometimes what looks like a rendering artifact isn’t a math error at all, but a synchronization issue between CPU and GPU.


Lesson Learned

Whenever the GPU produces results asynchronously, the CPU should never iterate over those results directly. Always work with a snapshot. Triple buffering (or even double buffering) is a small architectural change that guarantees stability and avoids subtle bugs that can masquerade as rendering issues.

This experience reinforced for me how crucial synchronization and data ownership are when building GPU-driven systems—sometimes the hardest-looking bugs aren’t about shaders or math, but about who’s allowed to touch the data, and when.

Deferred Entity Destruction in ECS: A Mark-and-Sweep Approach

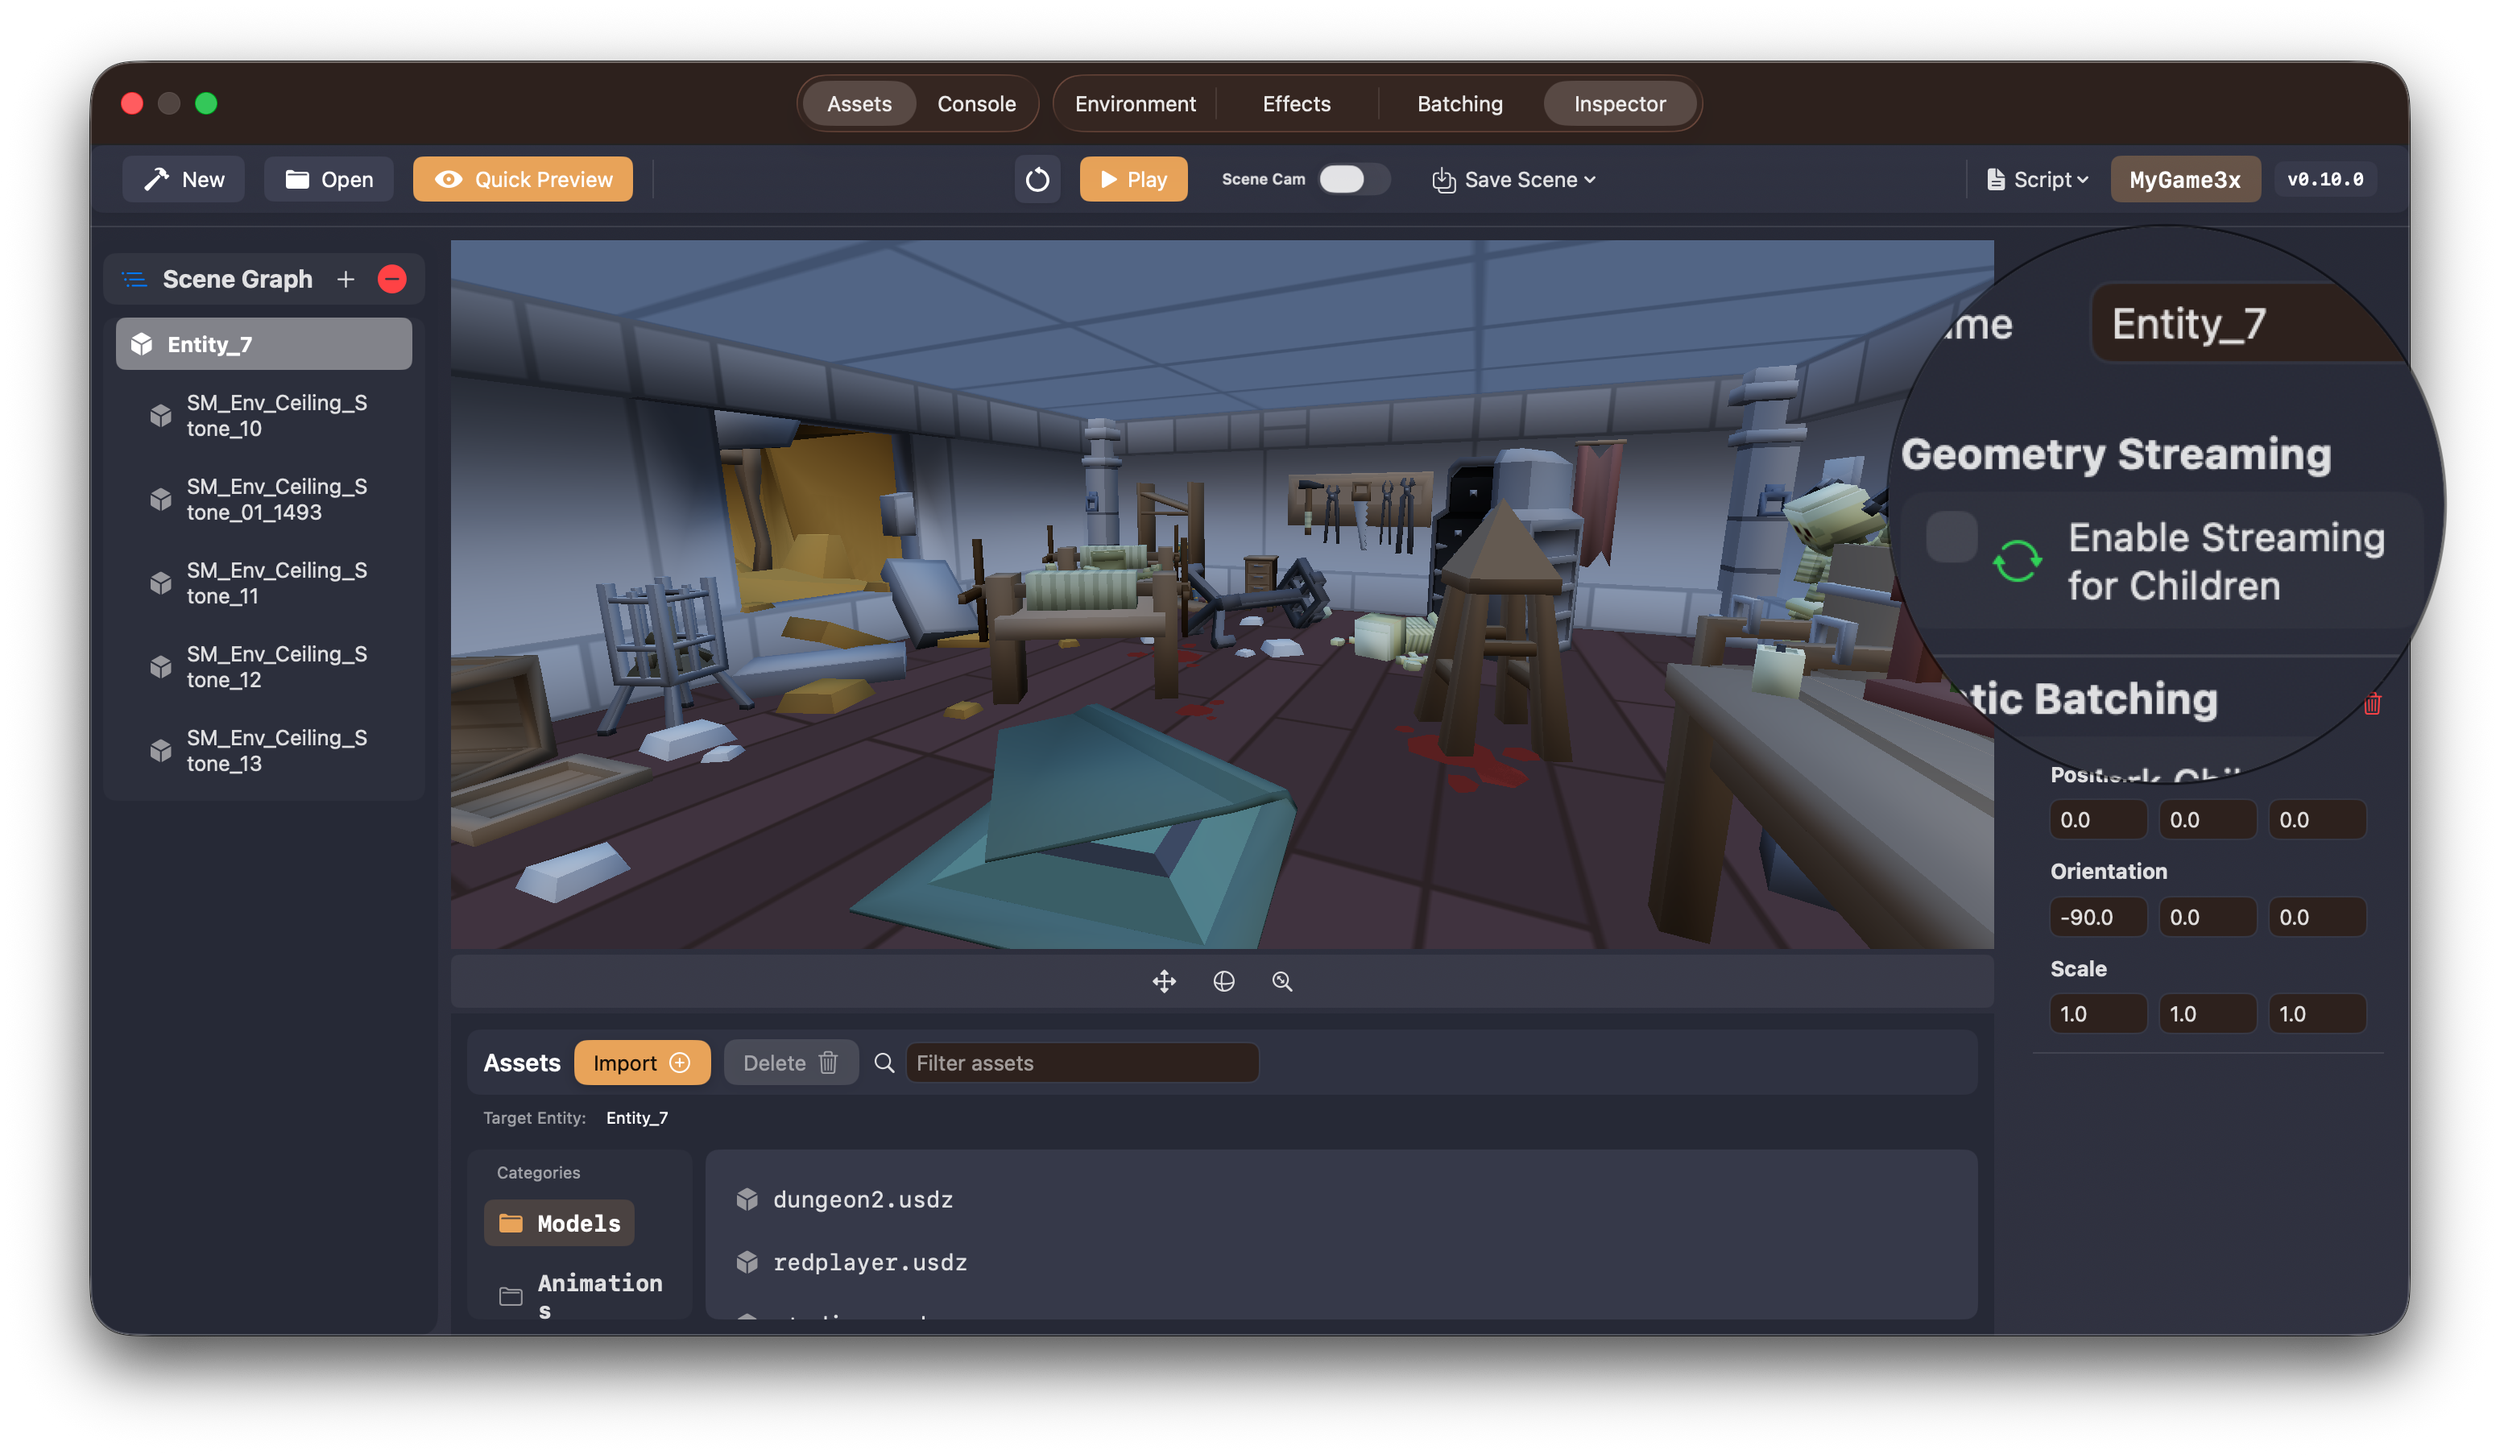
I found a bug in the Untold Engine in the weirdest way possible. After merging several branches into my develop branch, I decided to run a Swift formatter on the engine. Three files were changed. I ran the unit tests, they all passed, and then I figured I’d do a final performance check before pushing the branch to my repo.

So, I launched the engine, loaded a scene, and then deleted the scene.

The moment I did that, the console log started flooding with messages like:

  • Entity is missing or does not exist.
  • Does not have a Render Component.

This was the first time I had ever seen the engine behave like this when removing all entities from a scene. My first reaction was: the formatter broke something.

But the formatter’s changes were only cosmetic. There was no reason for this kind of bug.

At that point I was lost. So, I asked ChatGPT for some guidance, and it mentioned something interesting: maybe the formatter’s modifications had affected timing. That hint got me thinking.

After tinkering a bit, I realized the truth: this bug was always there. The formatter just exposed it earlier.

The Real Problem

My engine’s editor runs asynchronously from the engine’s core functions. When I clicked the button to remove all entities, the editor tried to clear the scene immediately — even if those entities were still being processed by a kernel or the render graph.

In other words, the engine was destroying entities while they were still in use. That’s why systems started complaining about missing entities and missing components.

The Solution: A Mini Garbage Collector

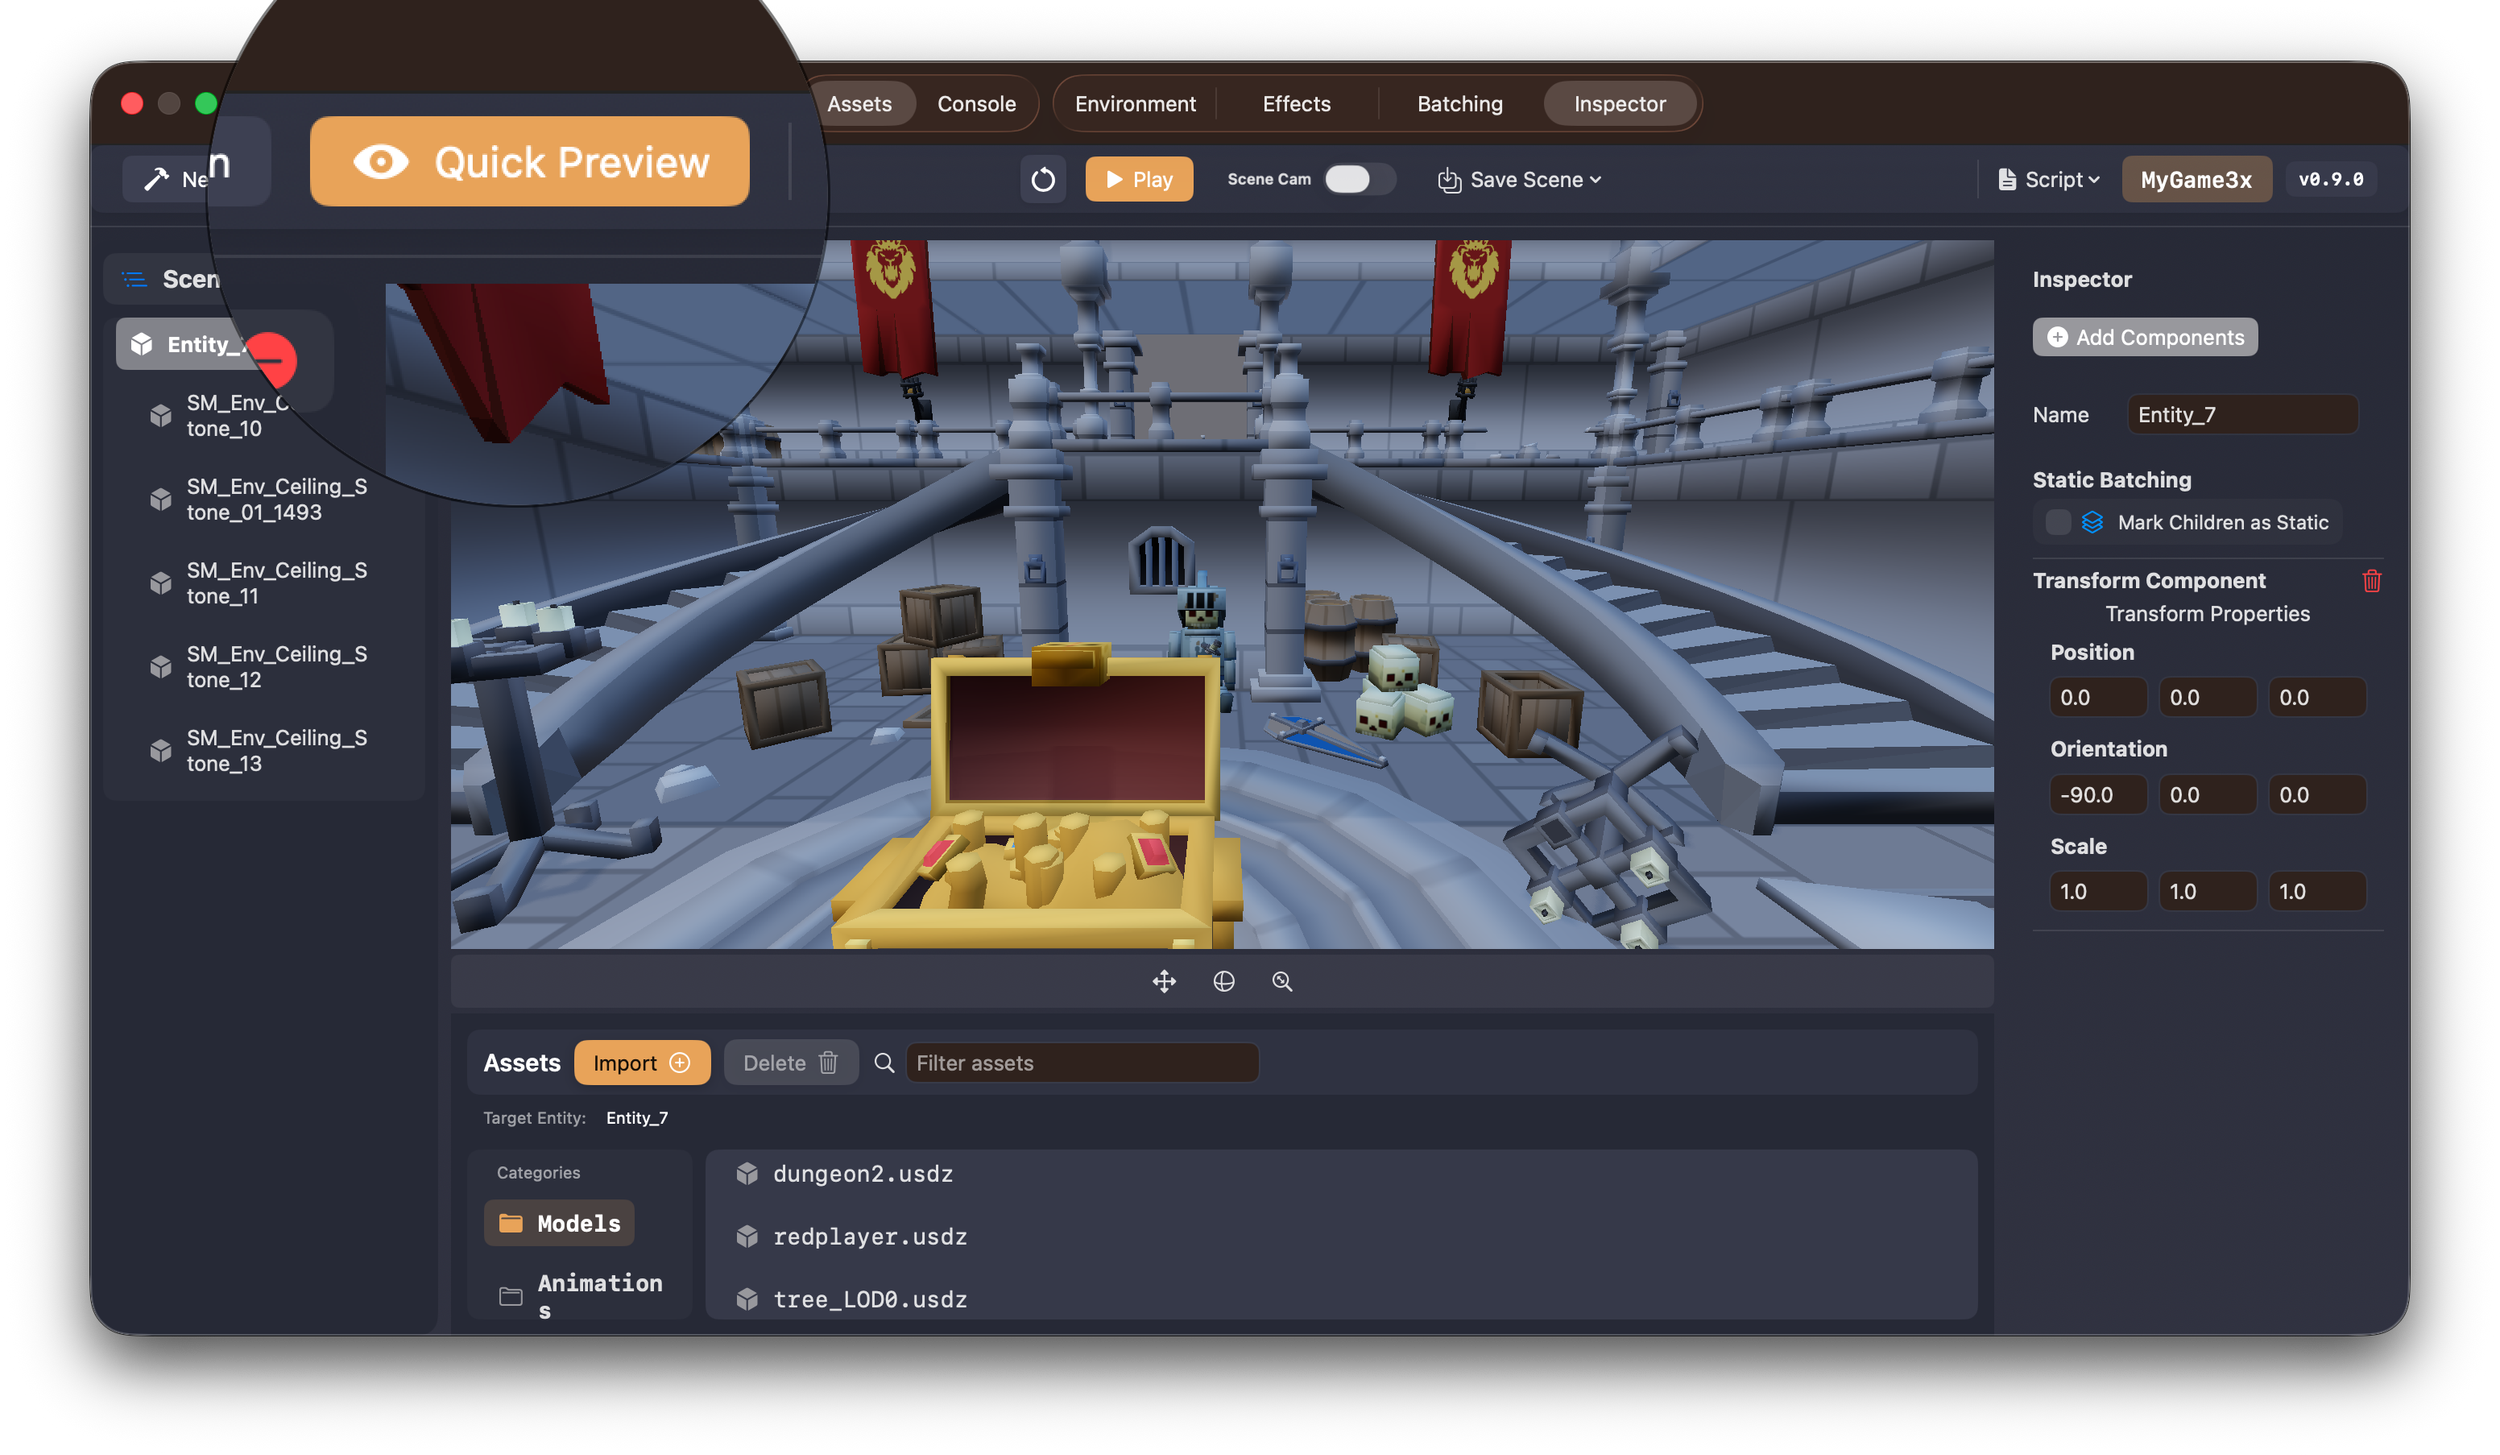
What I needed was a safe way to destroy entities. The fix was to implement a simple “garbage collector” for my ECS, with two phases:

  • Mark Phase – Instead of destroying entities right away, I mark them as pendingDestroy.
  • Sweep Phase – Once I know the command buffer has completed, I set a flag. In the next update() call, that flag triggers the sweep, where I finally destroy all entities that were marked.

This way, entity destruction only happens at a safe point in the loop, when nothing else is iterating over them.

Conclusion

What looked like a weird formatter bug turned out to be a timing bug in my engine. Immediate destruction was unsafe — the real fix was to defer destruction until the right time.

By adding a simple mark-and-sweep system, I now have a mini garbage collector for entities. It keeps the engine stable, avoids “entity does not exist” spam, and gives me confidence that clearing a scene won’t blow everything up mid-frame.

Thanks for reading.

From 26.7 ms to 16.7 ms: How a simple Optimization Boosted Performance

In my previous article, I talked about my attempts to improve the performance of the Untold Engine. Even after adding GPU frustum culling to reduce the CPU workload, the engine was still CPU-bound — stuck at around 26.7 ms per frame.

Profiling with Xcode Instruments pointed the finger at Metal’s encoder preparation, which appeared to take ~15 ms. Based on that, my next move seemed obvious: switch to a bindless rendering.

What does that mean? Instead of rebinding textures and material properties for every draw call, I would move everything into a single argument buffer. Each draw would reference materials by index. In theory, this should drastically cut CPU overhead and pair nicely with GPU-driven culling.

But reality didn’t match theory. After spending days moving to a bindless model, I ran the engine with 500 models — and the performance needle didn’t budge. In fact, things got worse: encoder prep time increased from ~15 ms to ~17 ms.

You can imagine my disappointment. But I kept digging. And then I found the real bottleneck. Instruments showed the CPU was spending almost 9.5 ms just preparing data for GPU frustum culling.

So the encoder wasn’t the problem after all. As I dug into the code, I discovered the true culprit: a single function that queries all entities with specific component IDs.


Here’s what was happening:

👉 My component mask was stored as an array of 64 booleans. Every time I checked an entity, the code looped through all 64 slots, read from two arrays, and branched on each one. With 500 entities, that meant tens of thousands of tiny checks every single frame. No wonder the CPU was choking.

The fix? Replace the boolean array with a single 64-bit integer and use a bitwise AND. That collapses the entire check into just two instructions. Here’s the new function:


That one change dropped the CPU frame time from 26.7 ms down to 16.7 ms. The GPU frame time sits at 9.3 ms.

In other words, the engine now runs at a solid 60 fps.

I’m happy with the results: the engine is no longer CPU-bound or GPU-bound.

But I’m not done yet. The next step is implementing occlusion culling — and I’m excited to see how far I can push performance.

Thanks for reading.

Profiling My CPU-Bound Game Engine: 50% Faster Encoder Setup

After adding several cool features to the Untold Engine (did I mention I added a console log), it was time to shift gears and focus on performance.


At the moment, rendering around 214,000 vertices (500 models), the engine was only hitting 29.51 FPS. That’s rough for real-time rendering. Clearly, something needed fixing.

Current State of the Engine: FPS 29.51

Profiling the Problem

I fired up Xcode’s GPU tools and the results were clear: the engine is CPU-bound.

  • CPU Frame Time: ~33.9ms
  • GPU Frame Time: ~8.1ms

So while the GPU was waiting around, the CPU was overloaded preparing work.

Untold Engine is CPU-Bound

Looking deeper with Instruments, I found the major culprit: Metal Encoder Setup Time. The CPU was spending ~31ms every frame just encoding commands into the GPU.

Metal Encoder Preparation

Why So Slow?

The bottleneck came from the Shadow and Geometry passes. Each frame, the CPU had to prepare encoders and push all material data for every model—base color, roughness, metallic textures, etc. With hundreds of models, this ballooned into a huge overhead.

First Fix: GPU Frustum Culling

The engine didn’t have any form of culling, so I decided to implement Frustum Culling. To avoid piling more work on the CPU, I pushed this logic onto the GPU.

The approach:

  • Construct the camera frustum.
  • Compute each entity’s world-space AABB.
  • Send bounding boxes to the GPU.
  • GPU checks if each AABB is inside the frustum.
  • If visible, the entity ID is written into an array via an atomic add.

The key here is that once the GPU returned the list of visible entities, the CPU only needed to encode draw calls for those entities—cutting encoder overhead. It’s a brute-force implementation, but it worked.

The Results

From the same view location,

  • FPS jumped from 29 → 37.
  • CPU Frame Time: 33.9ms → 26.7ms
  • Metal Encoder Setup Time: 31.0ms → 14.6ms
  • GPU Frame Time: 8.1ms (unchanged)

Improved FPS

Engine still CPU-Bound but is an improvement

Summary

Here’s the before-and-after snapshot:

  • FPS: 29 to 37 (+27% improvement)
  • CPU Frame Time: 33.9 ms to 26.7 ms (Encoder bottleneck reduced)
  • GPU Frame Time: 8.1 ms to 8.1 ms (Unchanged)
  • Metal Encoder Setup Time: 31.0 ms to 14.6 ms (Biggest gain)

Metal Encoder Duration decreased

Where Things Stand

The engine is still CPU-bound, but it’s in a noticeably better state than it was a week ago. By filtering out invisible objects early, I reduced the CPU’s workload and freed up encoder time. It’s not at 60 FPS yet—but the path forward is clearer.

What’s Next

Frustum culling was just the first step. To keep pushing toward 60 FPS, here are the next optimization I plan to explore:

  • Metal Bindless Rendering – Instead of rebinding textures and material properties for every draw, I’ll move to a bindless model. All materials will live in a single argument buffer, and each draw will reference them with a simple index. This should drastically cut down CPU encoder overhead and pair nicely with GPU-driven culling.

That’s where the engine stands today: better than last week, not yet where it needs to be. But the direction is clear, and each step forward is one step closer to real-time rendering.

Thanks for reading.

Optimizing My Engine’s Light Pass: Lessons from GPU Profiling

Now that the Untold Engine has most of the features that make it usable, I wanted to spend the next couple of months focusing on performance.


I decided to start with the Light Pass. For testing, I loaded a scene with around 214,000 vertices. Not a huge scene, but enough to get meaningful profiler data. After running the profiler, these were the numbers for the Light Pass:

  • GPU Time: 2.53 ms
  • ALU Limiter: 37.65%
  • ALU Utilization: 35.77%
  • Texture Read Limiter: 57.8%
  • Texture Read Utilization: 26.83%
  • MMU Limiter: 32.19%

The biggest limiter was Texture Read, at almost 58%. This means the GPU was spending a lot of time fetching data from textures—likely because they weren’t being cached efficiently. In hindsight, I should have started by tackling the biggest limiter. Instead, I first focused on improving the MMU. Not the best choice, but that’s how you learn.

MMU Limiter means your GPU performance is constrained by memory address lookups and fetches, not arithmetic.

Optimization 1: Buffer Pre-Loading

Buffer pre-loading combines related data into a single buffer so the GPU can fetch it more efficiently, instead of bouncing between multiple buffers. In my original shader, I was sending light data through separate buffers:

constant PointLightUniform *pointLights [[buffer(lightPassPointLightsIndex)]]

constant int *pointLightsCount [[buffer(lightPassPointLightsCountIndex)]]

I restructured this into a single struct that packages light data together. This change reduced the MMU Limiter from 32.19% → 26.43%.

Optimization 2: Use .read() Instead of .sample()

During the Light Pass, I fetch data from multiple G-buffer textures such as Position, Normal, Albedo, and SSAO. Originally, I used .sample(), but this does more work than necessary—it applies filtering and mipmap logic, which adds both memory traffic and math. Switching to .read() (a direct texel fetch) gave a noticeable improvement:

  • Texture Read Limiter: 57.8% → 46.79%
  • Texture Read Utilization: 26.83% → 30.03%

Optimization 3: Reduce G-Buffer Resolution

Next, I reduced the G-Buffer textures from float to half. I expected this to lower bandwidth usage, but to my surprise it made things worse:

  • Texture Read Limiter: 46.79% → 56.9%
  • Texture Read Utilization: 30.03% → 32.31%

Sometimes optimizations backfire, and this was one of those cases.

Optimization 4: Half-Precision Math in Lighting

I then focused on ALU utilization by switching parts of my lighting calculations to use half-precision (half) math. Specifically:

  • Diffuse contribution → half precision
  • Specular contribution → full precision (float)

The results were underwhelming:

  • ALU Limiter: 37.65% → 37.55%
  • ALU Utilization: 35.77% → 35.83%
  • F32 Utilization: 27.86% → 25.12%
  • F16 Utilization: 0% → 1.11%

Half-precision math showed up in the counters, but didn’t change the overall bottleneck.

Final Results

Here’s the overall improvement from all the optimizations:

Before → After

  • GPU Time: 2.53 ms → 2.31 ms (~8.7% faster)
  • Texture Read Limiter: 57.81% → 50.93%
  • MMU Limiter: 32.19% → 23.41%
  • ALU Limiter: 37.65% → 37.55% (flat)
  • F32 Utilization: 27.86% → 25.12%
  • F16 Utilization: 0.00% → 1.11%
  • Integer & Complex Limiter: 14.25% → 8.82%
  • Texture Read Utilization: 26.83% → 31.62%

What the Numbers Say

  • I shaved about 9% off the Light Pass—a real improvement, but not dramatic.
  • The biggest wins came from reducing memory-side pressure (MMU ↓, Texture Read Limiter ↓).
  • ALU stayed flat, which shows the pass is still memory/texture-bound, not math-bound.
  • Half-precision math registered, but didn’t help much since math wasn’t the bottleneck.
  • Removing unnecessary integer/complex math improved things locally, but again, the frame was dominated by texture fetch bandwidth.

Takeaway

Optimizations don’t always yield big wins, but each attempt brings clarity. In this case, the profiler clearly shows that the Light Pass is memory/texture-bound. My next steps will focus directly on reducing texture fetch cost, rather than trimming ALU math.

Thanks for reading.